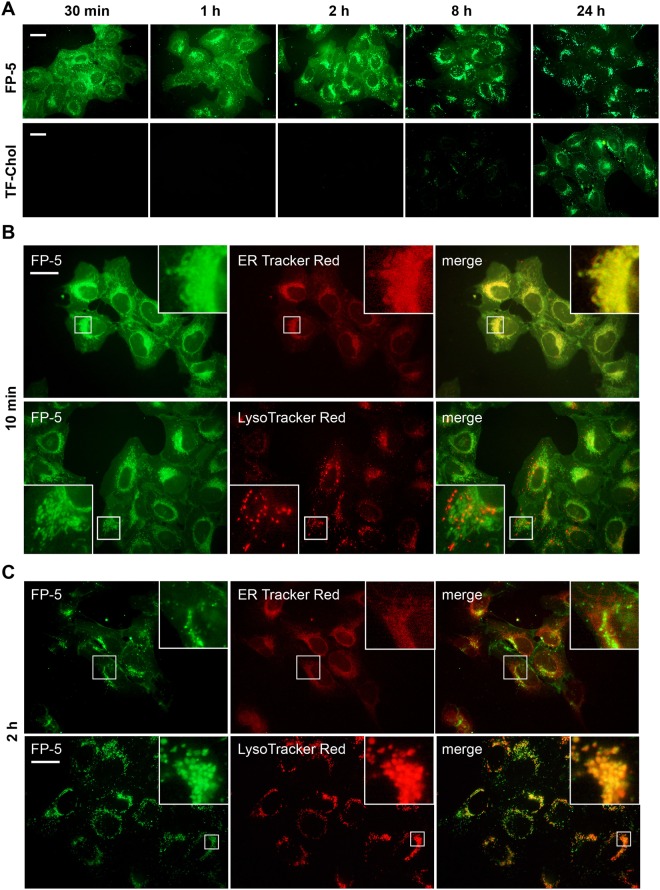
Figure 3.
The kinetics and localization of intracellular fluorescence of FP-5 and TF-Chol in U-2 OS cells. (A) Probes in DMSO solution were directly added to cultivation medium with 10% FCS at final concentration 0.5 μM and live fluorescence was recorded at indicated time points. Scale bar represents 10 μM. (B,C) Co-localization of FP-5 and organelle specific probes. Cells exposed to pulse with complex FP-5/MβCD (1 μg/ml) were chased for 10 min or 2 h, co-labelled with ER Tracker Red or LysoTracker Red and examined. Expansions of the regions indicated by the white boxes are shown on the upper right side or low left side. Localization of TF-Chol is included in Supplementary Fig. S15).

