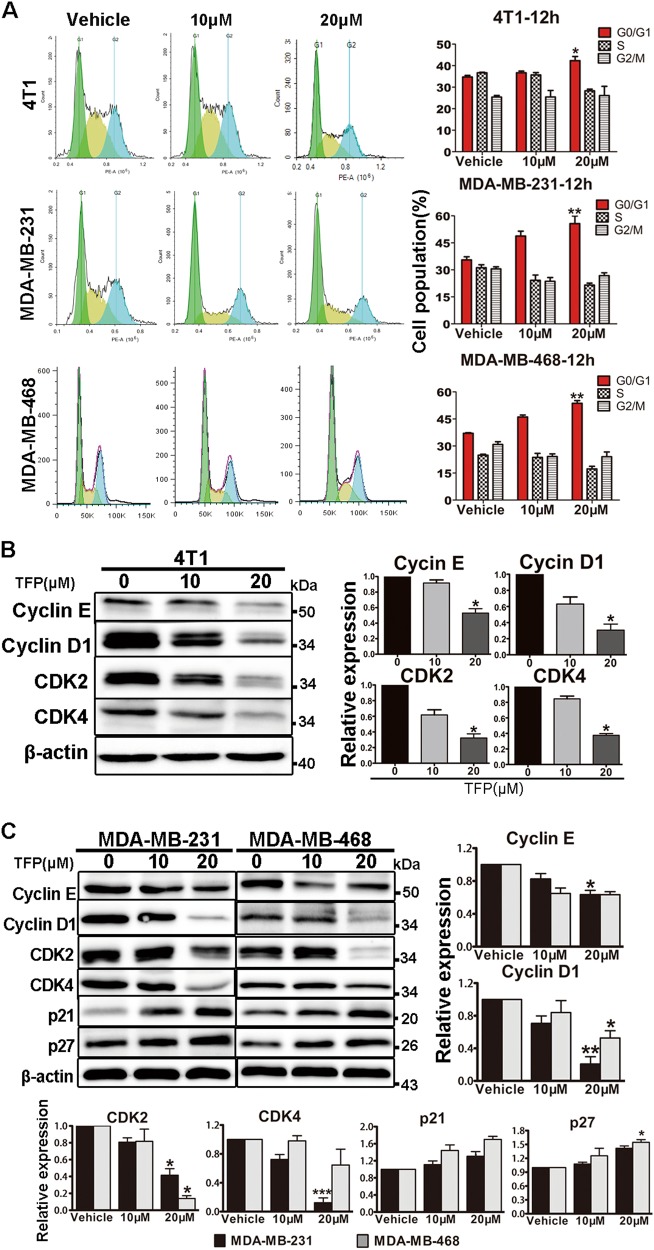
Fig. 2. TFP induced G0/G1 arrest in TNBC cells.
a 4T1, MDA-MB-231, and MDA-MB-468 cells were treated with indicated concentration of TFP for 12 h, respectively. The distribution of cell cycle was analyzed by flow cytometry. Data shown were representative of three independent experiments. The quantification is shown in right panels. Data were expressed as mean ± SD from three experiments (*P<0.05; **P < 0.01); the treatment group and the control group were compared by t test. b, c The effects of TFP on the expression of cyclin E, cyclin D1, CDK2, CDK4, p21, and p27 were determined by western blotting. β-actin was used as the loading control. The quantified values were shown (*P < 0.05; **P<0.01; ***P < 0.001); the treatment group and the control group were compared by t test

