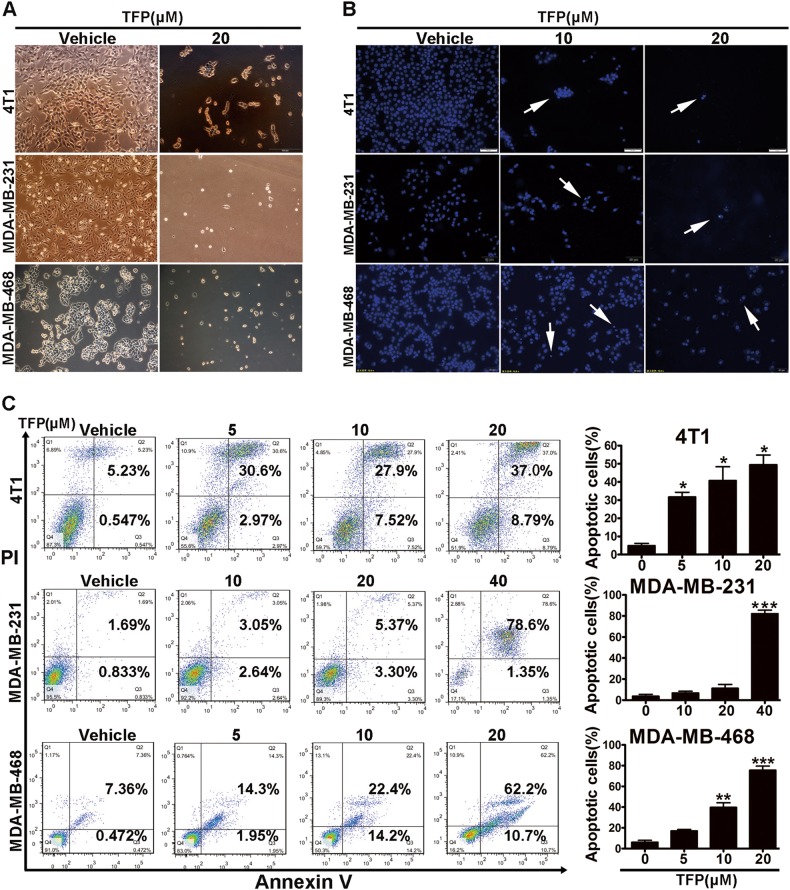
Fig. 3. TFP induced apoptosis of TNBC cells.
a The cell morphology of 4T1, MDA-MB-231, and MDA-MB-468 cells after treatment with TFP for 48 h. Scale bars represent 100 μm. b Nuclear alterations of 4T1, MDA-MB-231, and MDA-MB-468 cells after TFP treatment for 48 h. Cells were stained with Hoechst 33342 (10 μg/mL) and visualized by fluorescence microscopy. Scale bars represent 50 μm. c Flow cytometric analysis of TNBC cells apoptosis using the Annexin V/PI dual-labeling technique after TFP treatment for 48 h. The quantified values were shown in right panels (*P < 0.05; **P<0.01; ***P < 0.001); the treatment group and the control group were compared by t test

