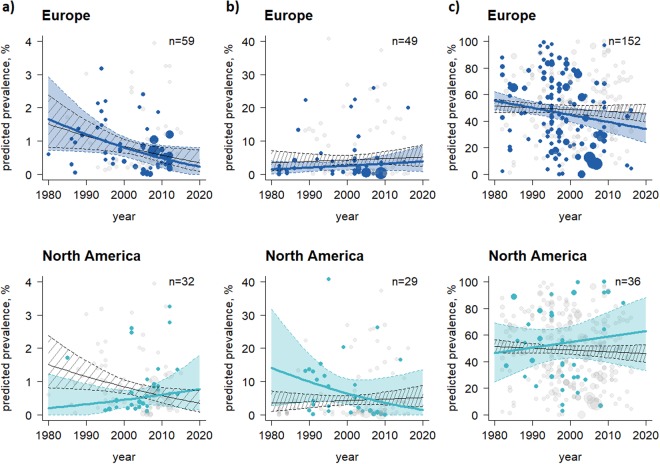
Figure 3.
Temporal trend analysis at animal level stratified by UN region, period and type of BVDV prevalences. (a) PI animals, (b) VI animals, and (c) AB-positive animals. The thin black lines represent the mean prevalence estimates of all 10 UN regions with the corresponding 95% CI (black shaded area) and individual prevalence points of studies in the 10 UN regions (grey dots) during the period observed. The coloured lines, areas and dots highlight the prevalence estimates for Europe and North America. The more prevalence estimates available at a certain time, the wider the dots. The predictions were calculated for all 10 UN regions together (black lines and shaded areas), as well as individually for Europe and North America (coloured) at the period, where the last dot is shown i.e., the PI prevalence in Europe and North America was predicted until 2020 based on data reported before 2013 and 2015, respectively. UN regions that had less than 15 sub-studies were not analysed individually. The abbreviation n represents the total number of sub-studies considered in Europe and North America (Tables 2–4). UN regions that recorded PI prevalences at animal level were used as a baseline for the UN regions that recorded VI and AB prevalences.

