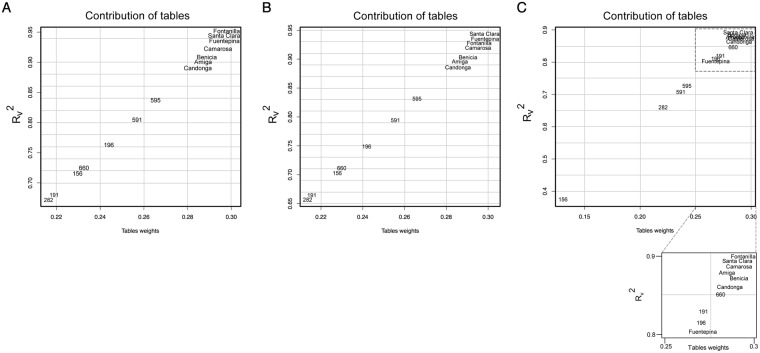
Figure 3.
STATIS analysis of the importance of data tables. (A) Contribution of tables obtained for all 14 data tables used in STATIS for 130 analyzed metabolites. The x-axis denotes the table weights and y-axes displays the Rv2 coefficient allowing assess the influence of tables on the resulting compromise. (B,C) Same analysis as in “a” but considering only secondary metabolites (87 metabolites) and primary metabolites (43 metabolites), respectively.

