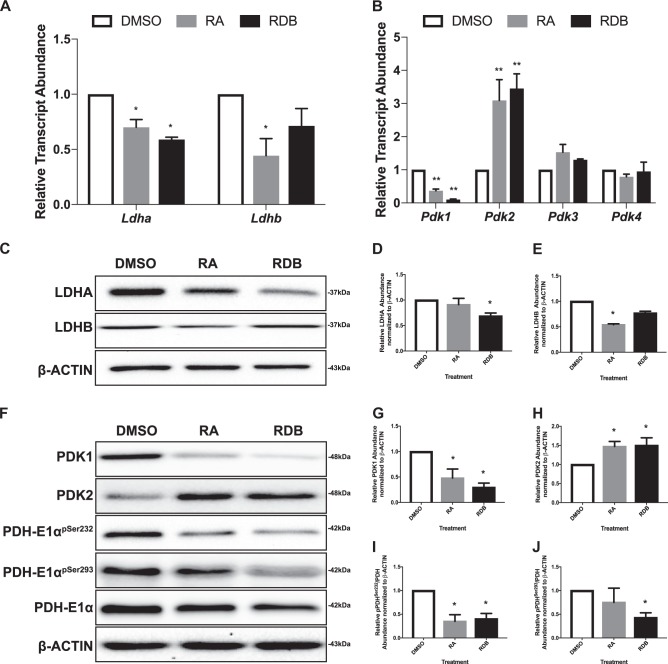
Fig. 2. Differentiated late-passage F9 cells downregulate transcripts and enzymes involved in inhibiting OXPHOS metabolism.
Relative transcript abundance of A Ldha and Ldhb, and B Pdks during F9 cell differentiation. L14 was used a constitutive gene for qRT-PCR. C Representative immunoblot and densitometric analyses (D, E) of LDHA and LDHB, respectively, during F9 cell differentiation. F Representative immunoblot showing PDK1, PDK2, PDH-E1αpSer232, PDH-E1αpSer293, and PDH-E1α levels, and densitometric analysis of G PDK1, H PDK2, I PDH-E1αpSer232, and J. PDH-E1αpSer293 levels. β-Actin served as a loading control. Values are presented as mean ± SEM of at least three biological replicates. Significance was tested using a one-way ANOVA followed by a Tukey’s test. *P < 0.05, **P < 0.01

