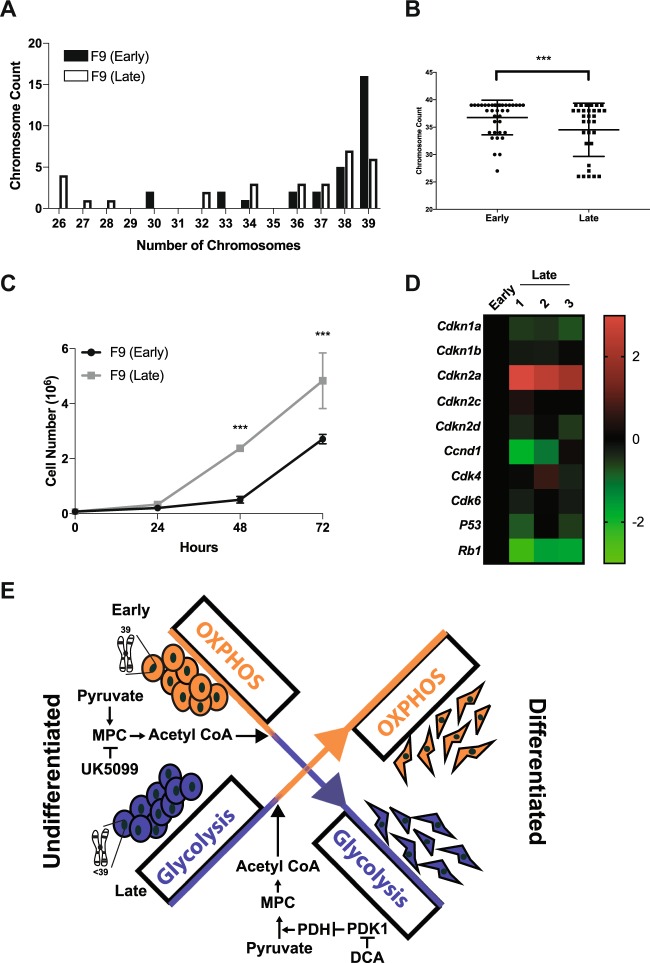
Fig. 8. Early-passage F9 cells display a genetically stable karyotype and proliferate slower than late-passage F9 cells.
A Number of chromosome, B chromosomal frequency, and C growth curve of early and late-passage F9 cells. D Differential expression of genes encoding proteins involved in cell cycle regulation and progression between early- vs. late-passage F9 cells. E Schematic overview of the mechanisms regulating metabolism in both populations. Values are presented as mean ± SEM of at least three biological replicates. Significance was tested using a one-way ANOVA followed by a Tukey’s test. Chromosomal distribution frequency was tested by χ2-test for the Goodness of Fit. ***P < 0.001

