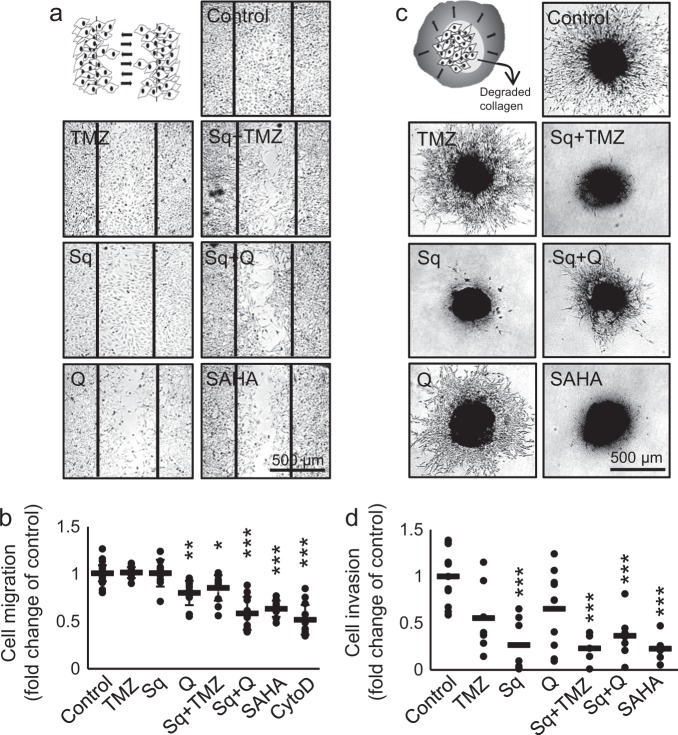
Figure 4. Sahaquine inhibits human glioblastoma cell migration and invasion.
Cell migration was measured using the scratch assay, as schematically represented in a. Representative micrographs show migration of cells into the scratch (delineated by vertical black bars) after treatment with temozolomide (100 µM, n = 12), sahaquine (Sq, 10 µM, n = 10), quercetin (Q, 100 µM, n = 12) or SAHA (10 µM, n = 10), alone or in combination (Sq + TMZ, n = 12; Sq + Q, n = 12) for 24 h. Cytochalasin D (40 nM, n = 13) served as a positive control. b Cell migration was quantified as the area covered by migrating cells. Each point represents a value normalized to the untreated control (set to 1, n = 35). Horizontal bars represent the mean (SD) from at least three independent experiments (*p < 0.05, **p < 0.01, ***p < 0.001, Welch’s ANOVA with Games–Howell post hoc test). c Cell invasion was measured from the radial movement of cells from 3D tumoroids embedded in a collagen matrix, as schematically represented in the first panel. Representative micrographs show cell movement from 3D tumoroids treated with temozolomide (100 µM, n = 7), sahaquine (Sq, 10 µM, n = 7), quercetin (Q, 100 µM, n = 10), or SAHA (10 µM, n = 5), alone or in combination (Sq + TMZ, n = 5; Sq + Q, n = 8) after 4 days. d Cell invasion was quantified from the area covered by invading cells. Each point represents a value normalized to the untreated control (set to 1, n = 11). Horizontal bars represent the mean from at least three independent experiments (***p < 0.001, two-tailed one-way ANOVA with Tukey–Kramer’s post hoc test)

