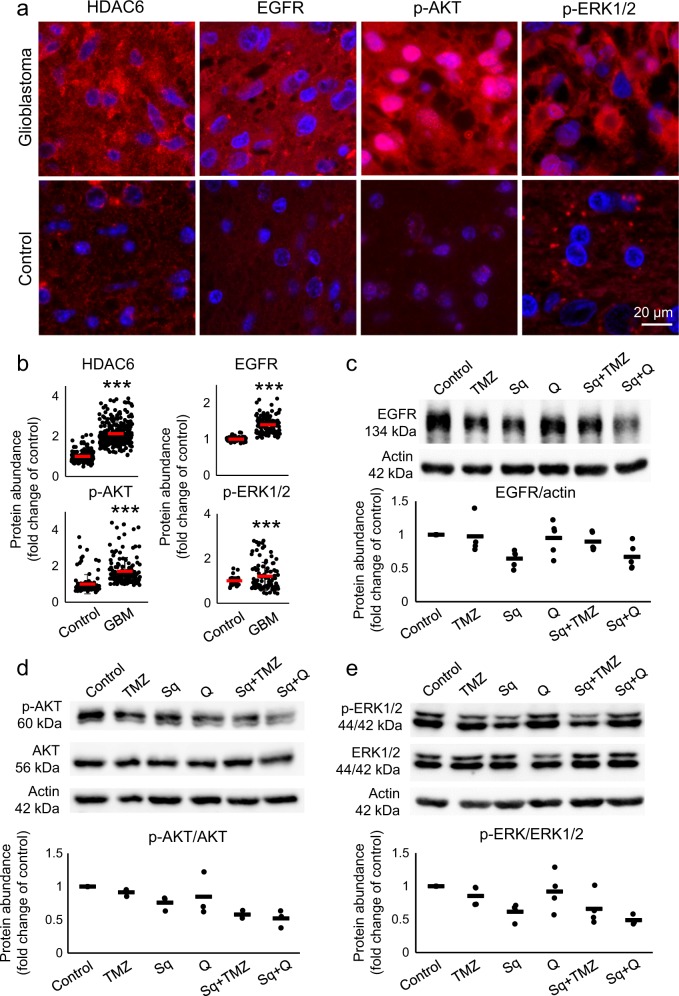
Figure 6. Sahaquine reduces EGFR abundance and AKT/ERK1/2 phosphorylation in human glioblastoma.
a Representative fluorescence micrographs of human brain sections (GBM or healthy control) labeled for HDAC6, EGFR, phosphorylated AKT (p-AKT), or dually phosphorylated ERK1/2 (p-ERK1/2). Nuclei (blue) were labeled with Hoechst 33342. Cells were imaged using a fluorescence microscope and fluorescence was analyzed in ImageJ. b Horizontal bars represent averages of fluorescence per cell (SD) for HDAC6 (control, n = 181 cells, GBM, n = 272 cells), EGFR (control, n = 94 cells, GBM, n = 116 cells), p-AKT (control, n = 115 cells, GBM, n = 147 cells) and p-ERK1/2 (control, n = 35 cells, GBM, n = 104 cells). Each point represents a value normalized to the healthy control (set to 1) (***p < 0.001, Welch’s ANOVA with Games–Howell post hoc test). c EGFR (TMZ, n = 4, Sq, n = 5, Q, n = 5, Sq + TMZ, n = 5, Sq + Q, n = 5), d phosphorylated AKT (n = 3), and e phosphorylated ERK1/2 (TMZ, n = 4, Sq, n = 4, Q, n = 4, Sq + TMZ, n = 4, Sq + Q, n = 3) protein abundances were measured in GBM cells treated with temozolomide (TMZ, 100 µM), sahaquine (Sq, 10 µM), or quercetin (Q, 100 µM) alone or in combination for 24 h, by Western blotting. EGFR protein abundance was normalized to the actin loading control. Phosphorylated AKT and ERK1/2 were normalized to total AKT and total ERK1/2, respectively. Each point represents a value normalized to the untreated control (set to 1). Horizontal bars represent means from at least three independent experiments

