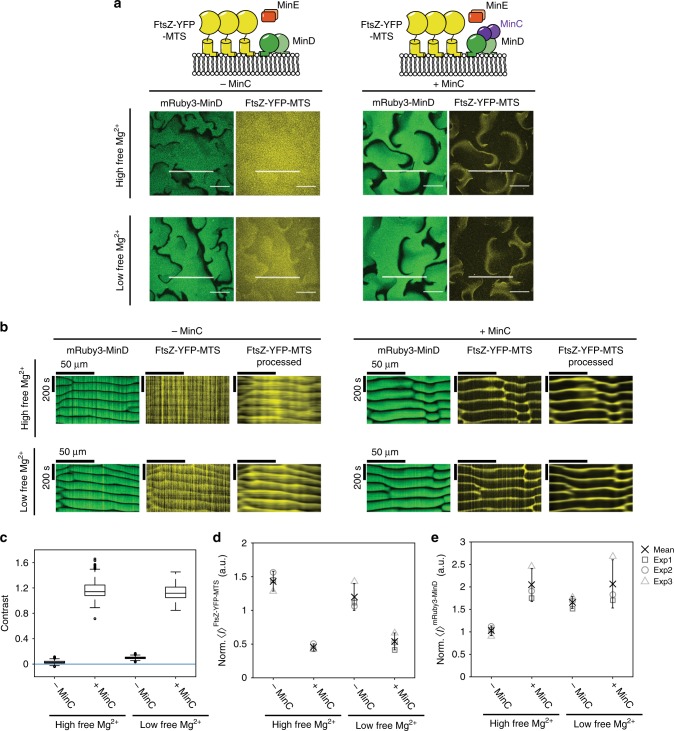
Fig. 5.
MinC enhances spatiotemporal regulation of FtsZ-YFP-MTS by MinDE. a Representative images of MinDE self-organization in the presence of FtsZ-YFP-MTS with high and low free Mg2+ (~5 and ~1 mM Mg2+) and with and without MinC (1 µM MinD (30 % EGFP-MinD), 1 µM MinE, 0.5 µM FtsZ-YFP-MTS, with and without 0.05 µM MinC) corresponding to the timepoint of 6.5 min. All images of the same spectral channel were acquired and displayed using the same instrumental settings. b Kymographs of the line selections shown in a. The kymograph for FtsZ-YFP-MTS is displayed for unprocessed images (middle panels) and preprocessed images (see Methods) (right panels). c MinC increases the regulation of FtsZ-YFP-MTS. Box plot of the contrast of FtsZ-YFP-MTS, lines are median, box limits are quartiles 1 and 3, whiskers are 1.5× IQR and points are outliers. Blue line marks no difference between the intensities in the minima and maxima of the MinDE wave (zero contrast). d Average FtsZ-YFP-MTS intensity of the full image normalized to a fluorescent standard. d Average mRuby3-MinD density of the full image normalized to a fluorescent standard. Each data point (square, sphere, triangle) (exp 1–3) was generated from one time series consisting of 150 frames. Cross and error bars represent the mean value and standard deviation of the three independent experiments

