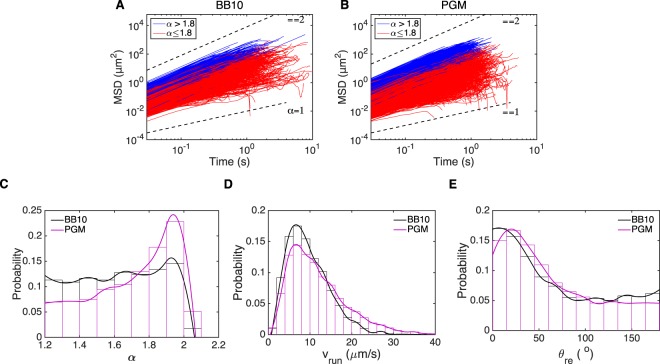
Figure 5.
(A,B) Analysis of MSD vs. time of all trajectories in BB10 (A) and PGM (B) along with distributions of the exponent α, run speed and reorientation angle. The blue (red) lines are the MSD of trajectories with α > 1.8 (α ≤ 1.8). Black dashed lines are reference lines for α = 1 and α = 2. (C) Smooth histogram of the α distribution of trajectories in BB10 (black) and PGM (magenta) (D,E). Smooth histogram of vrun (D) and θre (E) of H. suis swimming in BB10 (black) and PGM (magenta) at pH6. The histograms have 0.1 bin size for α, 2 μm/s bin size for vrun and 15° bin size for θre.

