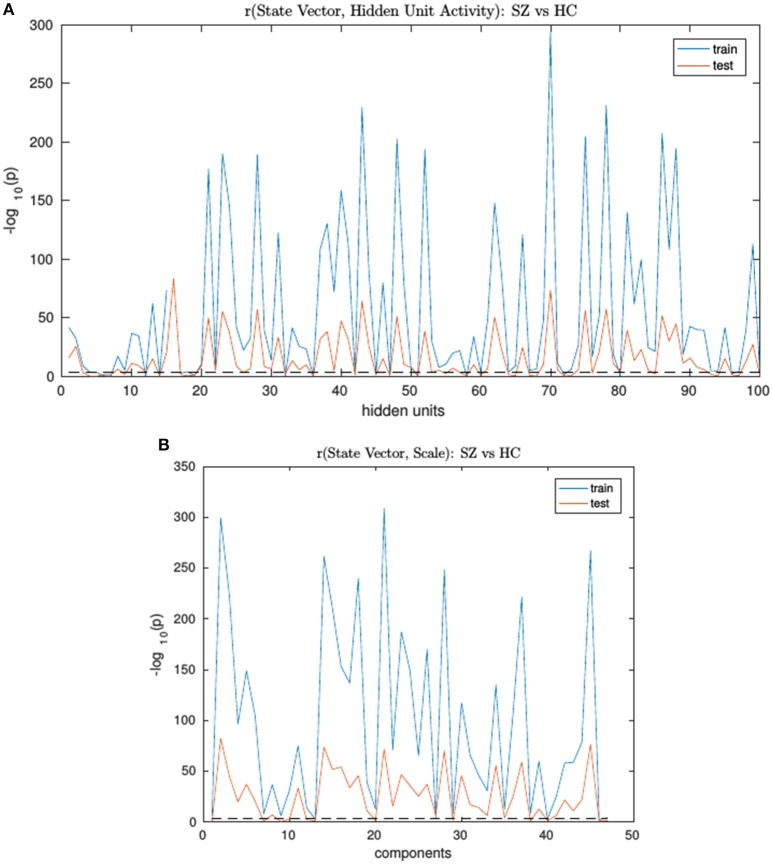
Figure 3.
The SimHC vs. SimSZ group differences of correlation between RNN hidden unit activations (A) and component scale factors (B) to the ground truth state vectors for train (blue) and test (red) subjects. Shown are −log10(p) values. Note same hidden units or component scale factors track group differences in both train and test cases although with lower strength in test cases. The dashed black line corresponds to the false discovery rate threshold of 0.001.

