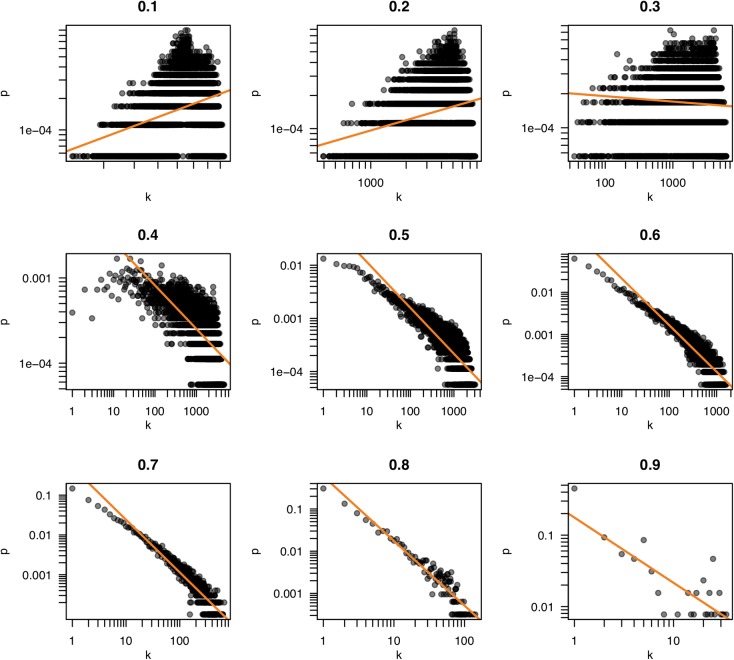
FIGURE 4.
Scale freedom of the hippocampal transcriptome network. The number of neighbors of each node (k) and the probability of nodes having k neighbors (p) are plotted for the correlation thresholds 0.1–0.9. The log-log plots of these values reveal a linear relationship when a network exhibits “scale free” behavior. Scale freedom is a property seen in most biological networks. Because the true biological network underlying a correlation network is expected to exhibit this behavior, a threshold where a linear relationship is first seen could indicate an appropriate threshold selection.

