
FIGURE 3.
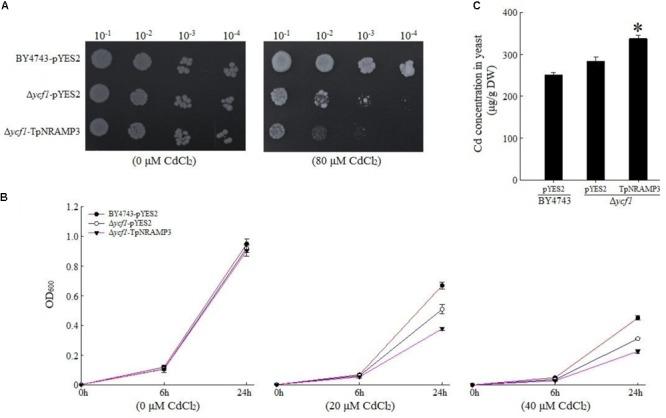
Sensitivity to Cd and Cd concentration in yeast. (A) Sensitivity to Cd when grown on plate SD medium with 80 μM CdCl2 (B) sensitivity to Cd when grown in liquid SD medium with 20 and 40 μM CdCl2; (C) Cd concentration in yeast when grown in SD medium with 20 μM CdCl2 for 48 h. Asterisk indicated significant difference when compared with WT at P < 0.05; value was mean ± standard deviation (three biological replicates).