
FIGURE 4.
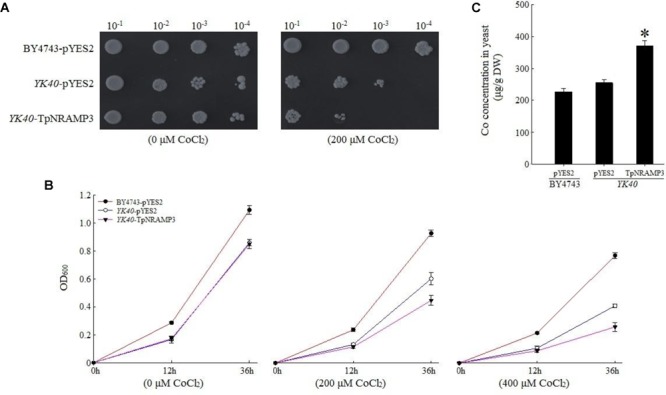
Sensitivity to Co and the Co concentration in yeast. (A) Sensitivity to Co when grown on plate SD medium with 200 μM CoCl2; (B) sensitivity to Co when grown in liquid SD medium with 200 and 400 μM CdCl2; (C) Co concentration in yeast when grown in SD medium with 50 μM CoCl2 for 60 h. Asterisk indicated significant difference when compared with WT at P < 0.05; value was mean ± standard deviation (three biological replicates).