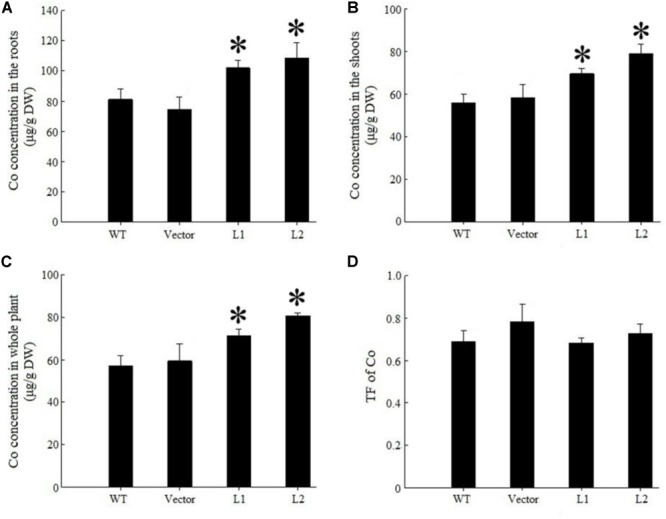
FIGURE 7.

Co concentration and TF of TpNRAMP3-expressing Arabidopsis. (A–C) Co concentration in roots, shoots, and whole plant, respectively; (D) Co TF. Asterisk indicated significant difference when compared with WT at P < 0.05; value was mean ± standard deviation (three biological replicates).
