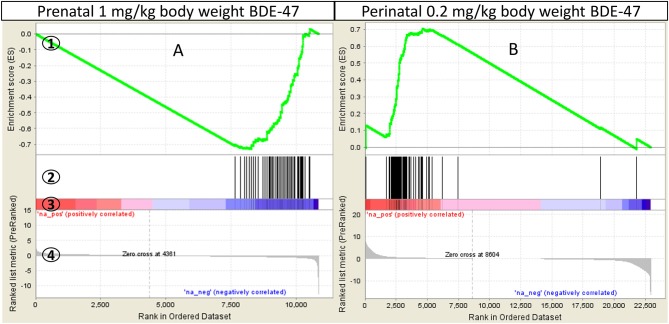
Figure 3.
GSEA enrichment of “KEGG Ribosome” gene set in mouse liver: (A)–mice were exposed prenatally to 1 mg/kg body weight BDE-47 and gene expression analyzed on PND300; (B)–mice were exposed perinatally to 0.2 mg/kg body weight BDE-47 and gene expression analyzed on PND140 (18). GSEA plot legend: 1-running enrichment score for the gene set; 2-vertical lines show where the members of the gene set appear in the ranked list of genes; 3 and 4-ranked list of differentially expressed genes from the most up-regulated (left of each plot) to the most downregulated (right of each plot). Regulation is shown in the heat-bar (3) and in the bar plot (4).

