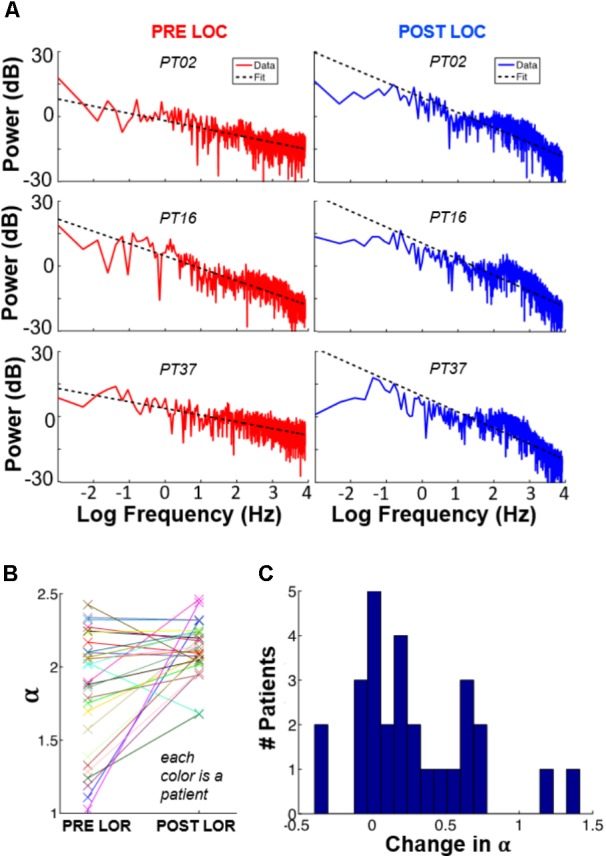
FIGURE 3.

1/f spectral changes occur with loss of response. We fit each patient’s spectral power to c/fα, where α and c were free parameters representing the quickness of frequency decay and an arbitrary constant, respectively. Panel (A) shows these plots for three patients, before and after LOC. (B) Values of α for each subject, pre-LOR and post-LOR. (C) Overall, we observed that 71% of the patients show an increase in α after LOR.
