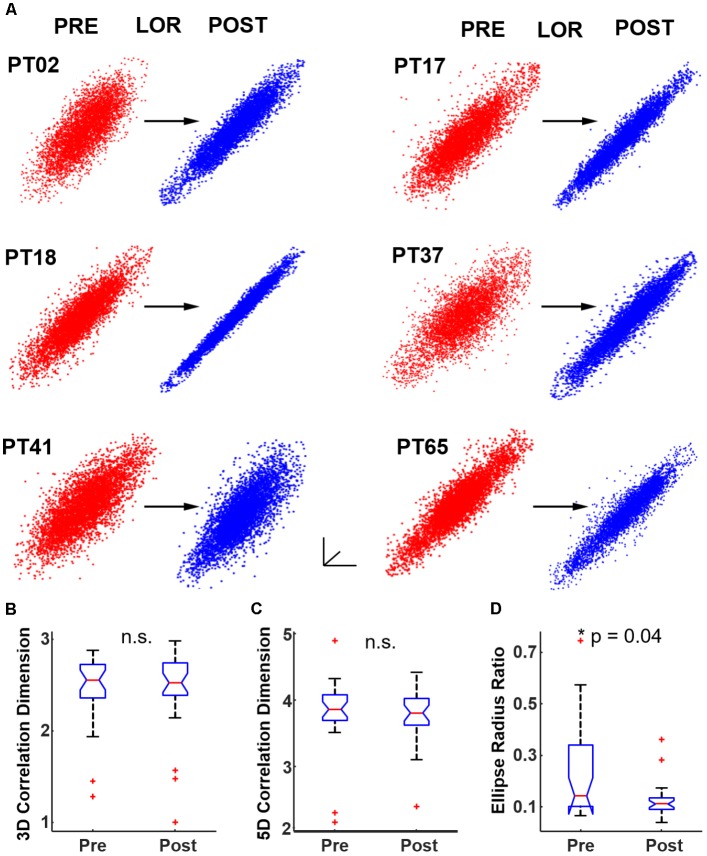
FIGURE 4.
Quantifying dynamical attractors before and after loss of response (LOR). (A) We created time-delayed embeddings (attractors) from 20 s continuous clips. A shape change from thicker, less-ellipsoidal attractors before LOR (red) to flatter, more ellipsoidal attractors after LOR (blue) was observed and is shown here for 6 patients. We quantified the difference in attractors using both correlation dimension and our ellipse radius ratio (ERR). (B) We did not observe a significant difference in correlation dimension in 3 dimensions, nor did we observe a significant difference in correlation dimension in 5 dimensions (C). (D) We did observe a significant difference in our ERR measure from before to after LOR (p = 0.04 corrected). The ∗ indicates significant difference between pre-LOR and post-LOR measures at p < 0.05 corrected.

