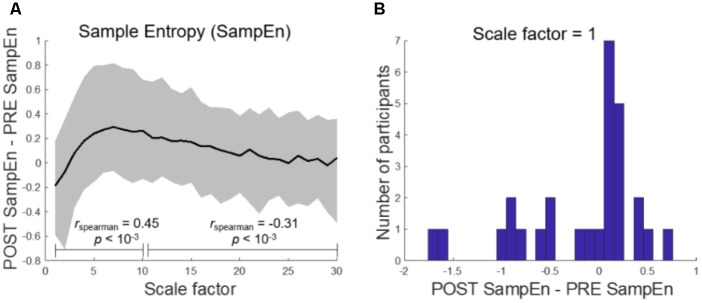
FIGURE 6.
Multiscale entropy reveals scale-dependent complexity change after loss of response. (A) Sample Entropy (SampEn) shows a decrease in complexity at short scale factors which monotonically increases until medium scale (rspearman = 0.45, p < 10-3) and then decreases toward 0 (rspearman = -0.31, p < 10-3). Here, the solid black line represents the mean. (B) At the shortest scale, the difference in SampEn between post-LOR and pre-LOR conditions is not significantly different from chance as measured by the median, but is when measured by mean (p = 0.04, percentile permutation test).

