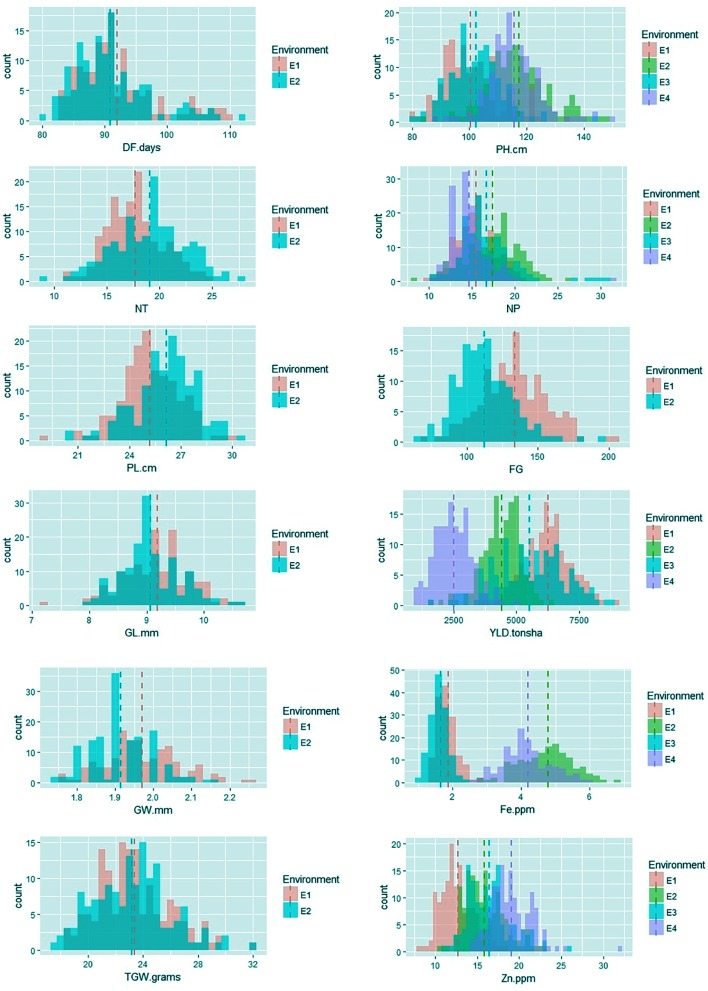
FIGURE 1.
Frequency distribution of agronomic and biofortification traits in the MAGIC Plus population evaluated in four environments. DF, days to 50% flowering; PH, plant height (cm); NT, number of tillers; NP, number of panicles; PL, panicle length (cm); GL, grain length (mm); GW, grain width (mm); FG, number of filled grains; TGW, thousand grain weight (g); YLD, grain yield (Kg/ha); Fe, iron (ppm); Zn, zinc (ppm); E, denotes environments in which MAGIC Plus population was evaluated; E1: IRRI, Los Baňos, Laguna during 2015DS; E2: IRRI, Los Baňos, Laguna during 2015WS; E3: PhilRice, Muňoz, Nueva Ecija during 2015DS; E4: PhilRice, Muňoz, Nueva Ecija during 2015WS; Dashed bars indicate mean of the population in each environment; The Y-axis shows the frequency and the X-axis shows the distribution for different traits, Different color codes indicates environments.

