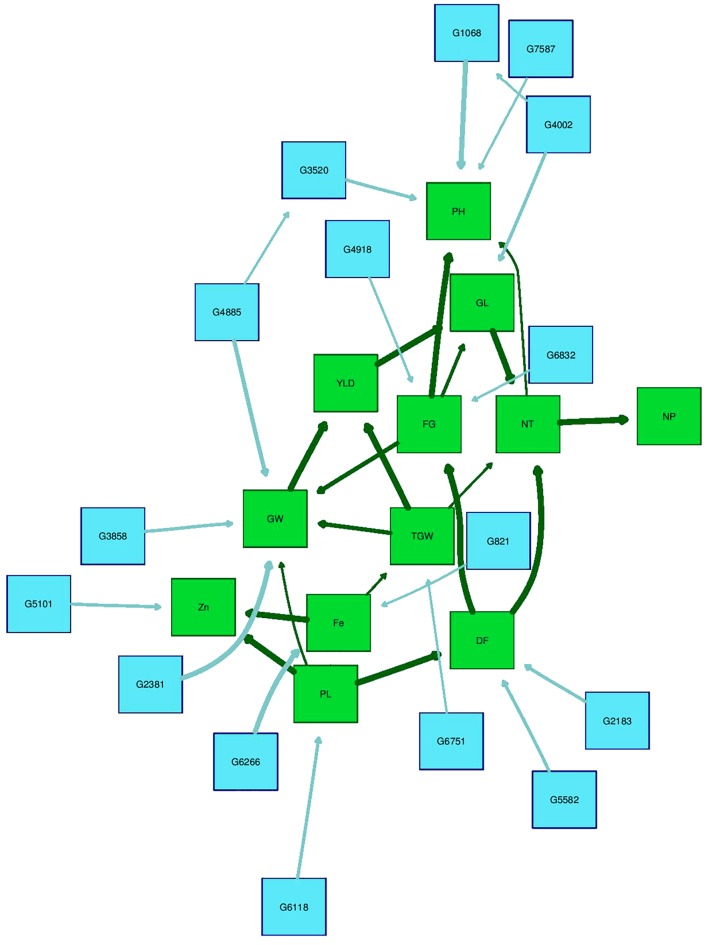
FIGURE 7.
Bayesian network of agronomic and biofortification traits observed in the MAGIC Plus population using genotypic data and BLUPs values from all environments. DF, days to 50% flowering; PH, plant height (cm); NT, number of tillers; NP, number of panicles; PL, panicle length (cm); GL, grain length (mm); GW, grain width (mm); FG, number of filled grains; TGW, thousand grain weight (g); YLD, grain yield (Kg/ha); Fe, iron (ppm); Zn, zinc (ppm); All labels with ‘G’ are the SNPs, The arrows indicate the direction of influence and thickness of the arrow indicates the degree of influence among different traits and with the SNPs.

