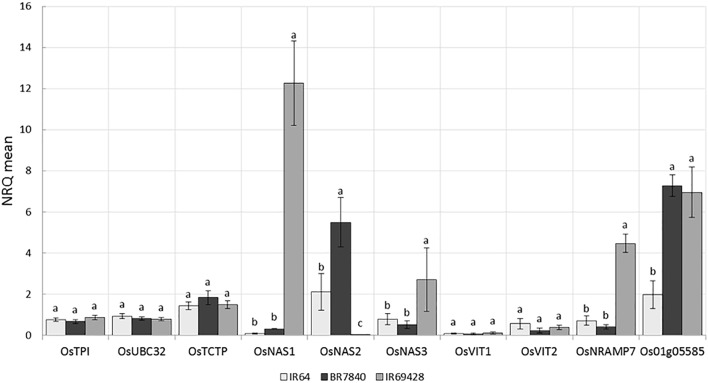
FIGURE 8.
Expression levels of reference and target genes in grains at 11 DAF (a) and 15 DAF (b) (5 biological replicates constituting of pooled seeds from five panicles or of a pool of 5 flag leaves were sampled and frozen in liquid nitrogen. Tissues were ground and total RNA extracted and used for qPCR analysis). The X-axis shows the genes and the Y-axis shows the level of expression in three rice genotypes.

