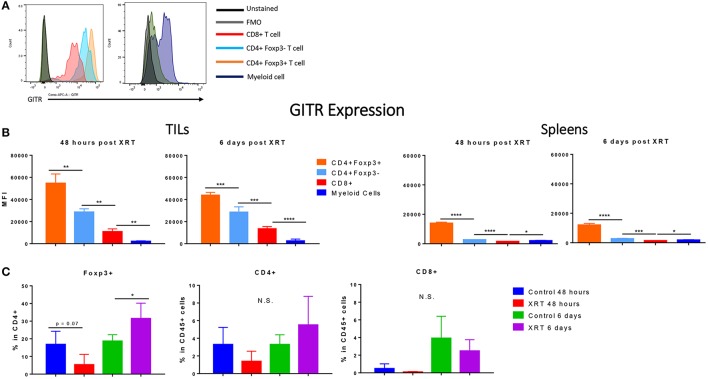
Figure 3.
Regulatory T cells express the highest levels of GITR, especially at the tumor site, and are increased by radiation. 2 and 6 days post XRT, immune cells were isolated and phenotyped through flow cytometric analysis from either unirradiated or irradiated mice. CD45+ cells were further gated into either CD4+, CD8+ or Foxp3+ within CD4+ (n = 4 per group). (A) These values are represented graphically. (B) Representative MFI (mean fluorescence intensity) of GITR expression in control mice, 48 h and 6 days post XRT in CD8+, CD4+ Foxp3–, CD4+ Foxp3+, and myeloid (Supplementary Figure 1) cells with unstained and FMO controls (n = 16). (C) Averages of mean fluorescence intensity (MFI) of CD4+ Foxp3+, CD4+ Foxp3–, CD8+, and myeloid cells from all treatment groups (n = 18). *P ≤ 0.05; **P ≤ 0.01; ***P ≤ 0.001; ****P ≤ 0.0001 in Student t-tests; N.S., not statistically significant.

