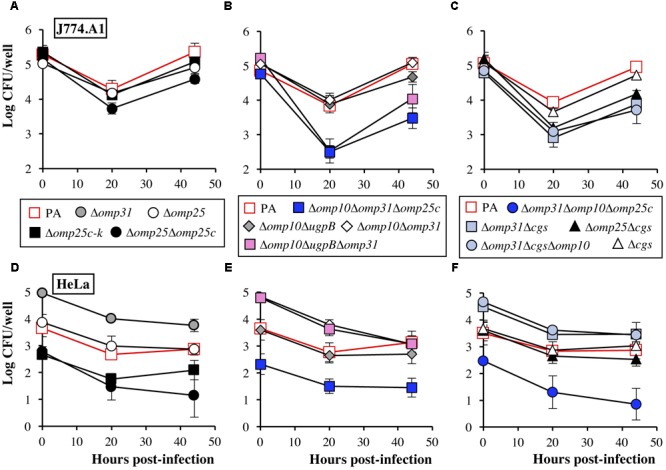
FIGURE 6.

Internalization and intracellular behavior of B. ovis PA and selected mutants in J774.A1 murine macrophages (A–C) and HeLa cells (D–F). The results are expressed as the means ± SD (n = 3) of the log CFU/well at each time point. To simplify the figure, relevant statistically significant differences (P < 0.05) are mentioned in the text.
