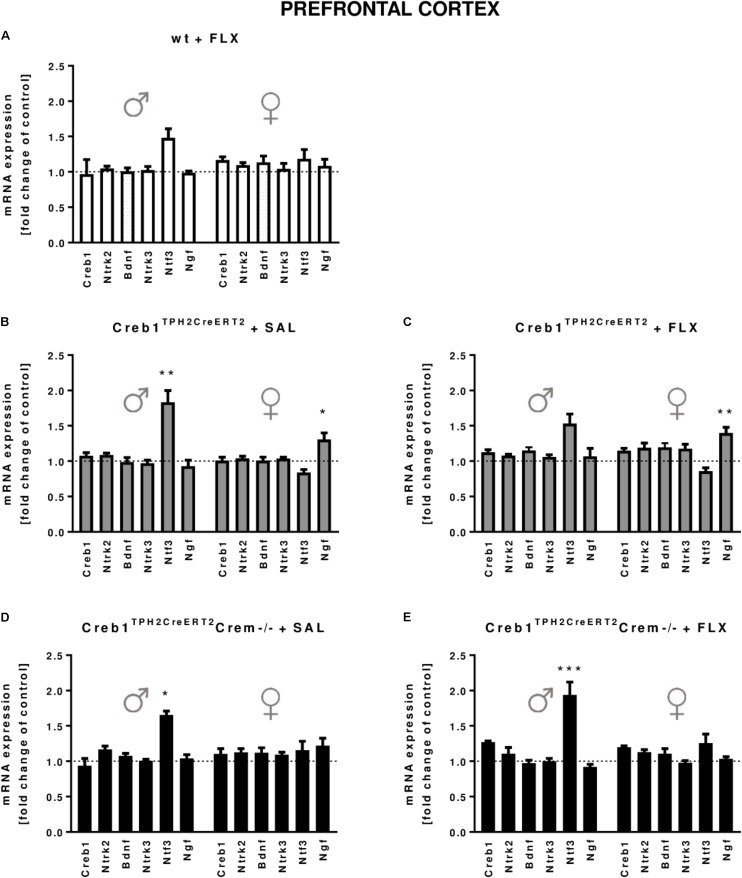
FIGURE 3.
mRNA expression of genes encoding for Creb1, neurotrophins (Bdnf, Ngf, and Ntf3) and their receptors (Ntrk2, Ntrk3) in the prefrontal cortexes (PFCs) of saline- and fluoxetine-treated wild-type, Creb1TPH2CreERT2, and Creb1TPH2CreERT2Crem–/– mice. In the PFC of male Creb1TPH2CreERT2 (saline-treated mice) and Creb1TPH2CreERT2Crem–/– mutants (saline- and fluoxetine-treated mice), increased NTF3 mRNA levels were observed. However, Creb1TPH2CreERT2 females after both saline and fluoxetine treatment show increased Ngf mRNA expression levels. Bars represent fold changes in the mRNA expression of Creb1, Bdnf, Ngf, Ntf3, Ntrk2, and Ntrk3 vs. that in wild-type non-treated animals (dot line) in the PFC of (A) wild-type fluoxetine-treated, (B,C) Creb1TPH2CreERT2 saline- and fluoxetine-treated, and (D,E) Creb1TPH2CreERTCrem–/– saline- and fluoxetine-treated mice. All graphs represent data from males (left) and females (right). Data are presented as the mean ± SEM. ∗p < 0.05, ∗∗p < 0.01, ∗∗∗p < 0.001 vs. saline-treated wild-type mice of the same sex. W/t, wild-type; FLX, fluoxetine.

