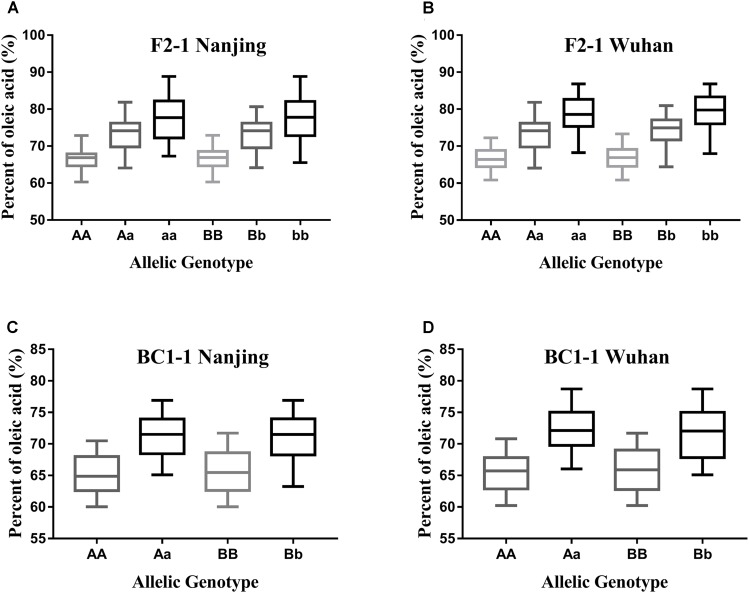
FIGURE 6.
Distribution of the oleic acid content for lines with different allelic genotypes in the segregation populations. Genotype effects mediated by the BnFAD2-1 (three genotypes: AA, Aa, and aa) and BnFAD2-2 (three genotypes: BB, Bb, and bb) genes are shown for the F2 population (A,B) and BC1 population (C,D) at two sites (Nanjing and Wuhan).

