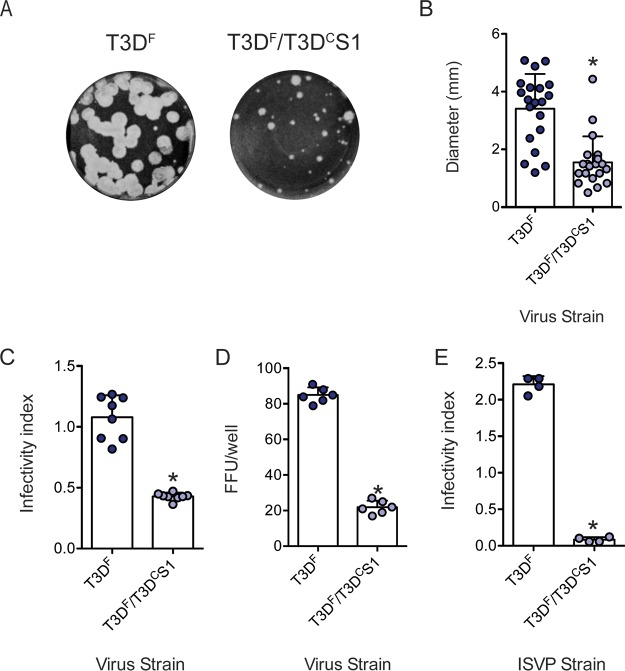
FIG 1.
T3DF/T3DCS1 exhibits small-plaque morphology and reduced infectivity in L929 cells. (A) Particles of T3DF or T3DF/T3DCS1 diluted in PBS were subjected to plaque assay. (B) Sizes of 20 randomly selected plaques and means are shown. Error bars indicate standard deviations (SD). *, P < 0.05 as determined by Student's t test compared to T3DF. L929 cells were adsorbed with 3,000 particles/cell of either T3DF or T3DF/T3DCS1 (C), 300 particles/cell of T3DF or T3DF/T3DCS1 (D), or 300 ISVPs/cell of either T3DF or T3DF/T3DCS1 (E) at room temperature for 1 h. (C and E) After incubation at 37°C for 18 h, the cells were subjected to indirect immunofluorescence assay using a LI-COR Odyssey scanner. (C and E) Relative infectivity was determined by calculating intensity ratios at 800 nm (green fluorescence), representing viral antigen, and 700 nm (red fluorescence), representing the cell monolayer. The infectivity index for each independent infection and the sample means are shown. Error bars indicate SD. *, P < 0.05 as determined by Student's t test compared to T3DF. (D) Number of antigen-positive cells or fluorescent focus units (FFU) in the entire well were manually quantified. FFU/well for each well and sample mean are shown. Error bars indicate SD. *, P < 0.05 as determined by Student's t test compared to T3DF.

