
FIG 3.
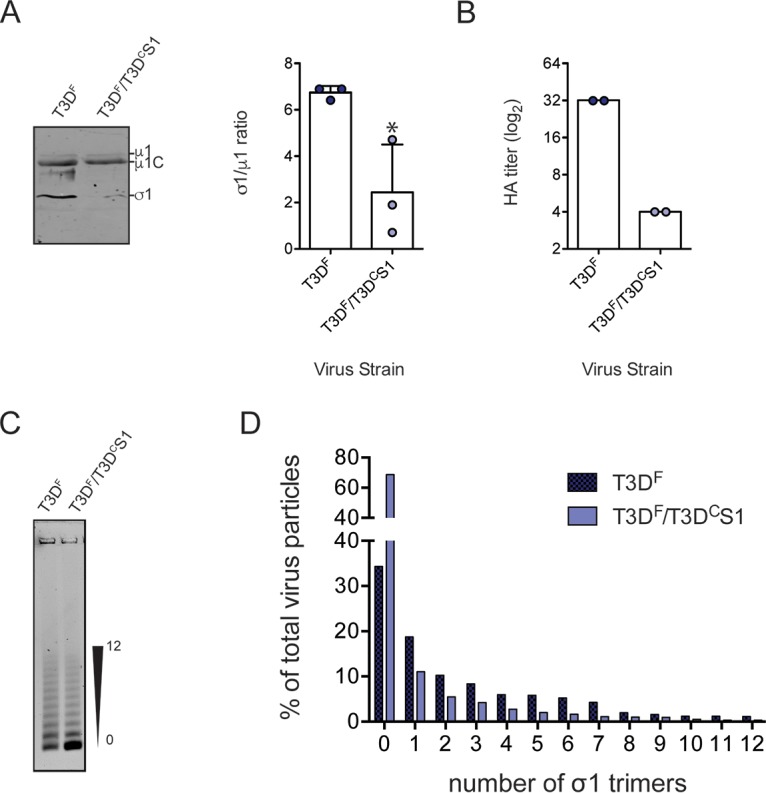
Lower level of σ1 is present on T3DF/T3DCS1 particles. (A) Purified T3DF or T3DF/T3DCS1 (2 × 10¹⁰ particles) virions from 3 independent viral preparations were subjected to immunoblotting using antibodies directed against reovirus μ1 protein and T3D σ1 head. Membranes were scanned on a LI-COR Odyssey scanner to determine σ1 and μ1 band intensities. The σ1/μ1 ratios of each independent virus preparation and means are shown. Error bars indicate SD. *, P < 0.05 as determined by Student's t test compared to T3DF. (B) Purified T3DF or T3DF/T3DCS1 virions (1 × 10¹¹ particles) were serially diluted in PBS and incubated with bovine erythrocytes at 4°C overnight. HA titer was expressed as 2 × 10¹¹ particles divided by the number of particles per HA unit for each independent sample, and the mean values are shown. One HA unit is equal to the number of particles of virus sufficient to produce HA. (C and D) Virions (1 × 10¹¹ particles) were resolved on an agarose gel, stained with a colloidal blue staining kit, and scanned using a LI-COR Odyssey scanner. (C) The position of particles with the lowest and highest numbers of σ1 trimers is shown. (D) The band intensity of each virion species was quantified. The abundance of each species as a percentage of all 13 virion species present in the sample is shown.