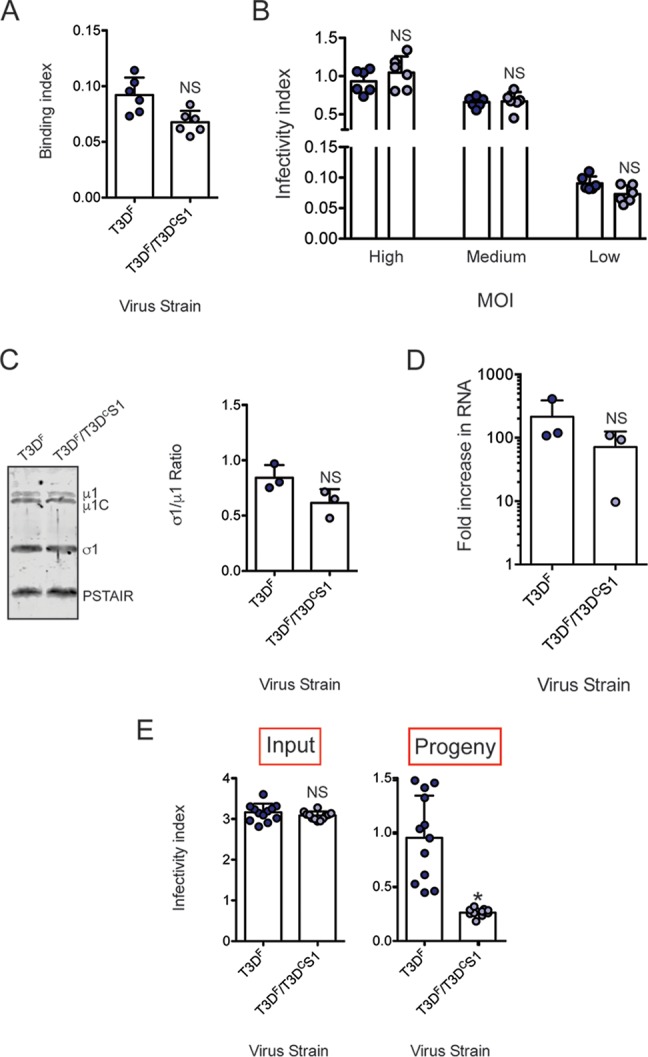
FIG 4.

Inefficient assembly contributes to lower level of σ1 on T3DF/T3DCS1 particles. (A) L929 cells grown in 96-well plates were chilled at 4°C for 15 min and then adsorbed with 5 × 10⁴ particles/cell of T3DF or 1 × 10⁵ particles/cell of T3DF/T3DCS1 at 4°C for 1 h. Cell attachment was determined by indirect immunofluorescence of cell-associated particles using a LI-COR Odyssey scanner. Binding index was determined by calculating intensity ratios at 800 nm (green fluorescence), representing viral antigen, and 700 nm (red fluorescence), representing the cell monolayer. The binding index for each independent infection and the sample means are shown. Error bars indicate SD. NS, P > 0.05 as determined by Student's t test compared to T3DF. (B) L929 cells were adsorbed with 3,000, 300, and 30 particles/cell of either T3DF or 6,000, 600, and 60 particles/cell of T3DF/T3DCS1 at room temperature for 1 h. These conditions are designated high, medium, and low MOI, respectively. After incubation at 37°C for 18 h, the cells were subjected to indirect immunofluorescence assay using a LI-COR Odyssey scanner. Relative infectivity was determined by calculating intensity ratios at 800 nm (green fluorescence), representing viral antigen, and 700 nm (red fluorescence), representing the cell monolayer. The infectivity index for each independent infection and the sample mean are shown. Error bars indicate SD. NS, P > 0.05 as determined by Student's t test compared to T3DF at equivalent attachment units. (C) Whole-cell lysates of cells infected with 3,000 particles/cell T3DF or 6,000 particles/cell of T3DF/T3DCS1 were subjected to immunoblotting using antibodies directed against reovirus μ1 protein and T3D σ1 head. Membranes were scanned on a LI-COR Odyssey scanner to determine σ1 and μ1 band intensities. σ1/μ1 ratios for each independent infection and the sample mean are shown. Error bars indicate SD. NS, P > 0.05 as determined by Student's t test compared to T3DF. (D) RNA extracted from cells infected with 3,000 particles/cell T3DF or 6,000 particles/cell of T3DF/T3DCS1 at 0 and 24 h postinfection was subjected to RT-PCR to measure the level of minus strand for the viral M2 gene relative to cellular GAPDH mRNA. The fold increase in the minus strand for each independent infection and sample means are shown. Error bars indicate SD. NS, P > 0.05 as determined by Student's t test compared to T3DF. (E) L929 cells were adsorbed with 30 particles/cell of T3DF or 60 particles/cell of T3DF/T3DCS1 at room temperature for 1 h. After incubation at 37°C for 24 h, medium supernatant was used to infect fresh L929 cells. Relative infectivity of input virus (in the original plate) and that of progeny virus (in a fresh plate) was determined by calculating intensity ratios at 800 nm (green fluorescence), representing viral antigen, and 700 nm (red fluorescence), representing the cell monolayer. The infectivity index for each independent infection and the sample mean are shown. Error bars indicate SD. NS, P > 0.05 as determined by Student's t test compared to T3DF. *, P < 0.05 as determined by Student's t test compared to T3DF.
