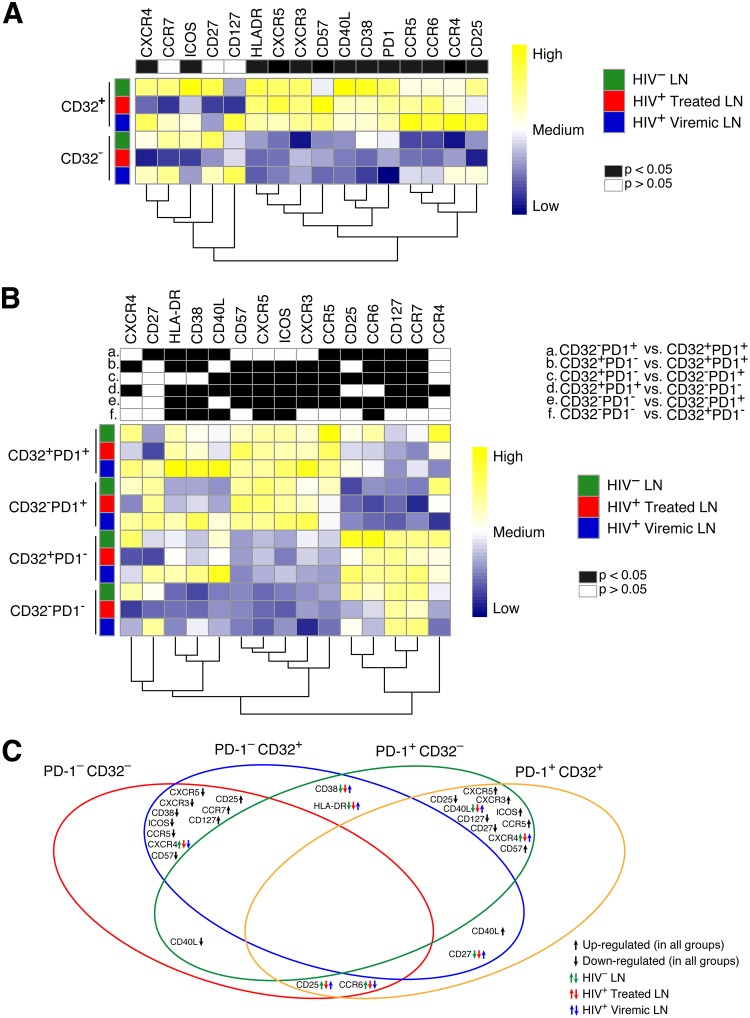
FIG 4.
Mass cytometry analysis of LN memory CD4 T cells defined by CD32 and/or PD-1 expression. Mass cytometry staining was performed on LN mononuclear cells isolated from 9 HIV-1-uninfected, 16 HIV-1-infected ART-treated, and 9 viremic individuals. Cells were stained with a panel of 30 cell surface markers (Table 2). (A and B) Heat maps of mean marker expression levels in memory CD4 T cells defined on the basis of CD32 (A) and CD32 and PD-1 (B) expression. Columns (i.e., markers) are scaled to facilitate comparisons of expression values color-coded from blue (low) to yellow (high). (C) Venn diagram summarizing common trends and the direction of changes for significant markers (as in panel B) in CD45RA− CD4 T cells defined on the basis of PD-1 and CD32 expression. Black arrows indicate trends that are common to all study groups (HIV-uninfected, ART-treated, and viremic individuals). Green, red, and blue arrows indicate trends that are specific to each study group.

