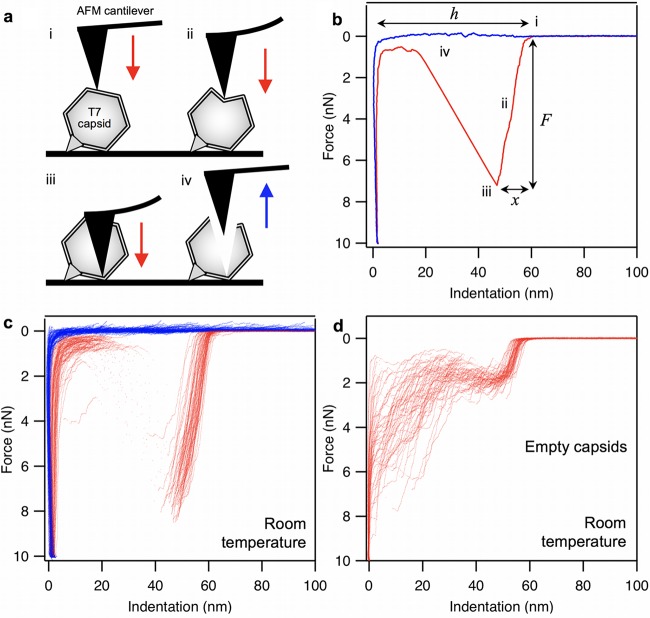
FIG 1.
Nanomechanics of T7 phages. (a) Schematics of mechanical manipulation. The tip of the AFM cantilever is first brought into contact with the T7 phage surface (i), which is then pressed (ii) with a preadjusted velocity to 10 nN maximal force, during which the capsid eventually ruptures (iii). Finally, the cantilever is lifted (iv). AFM cantilever and T7 phage are not to scale. (b) Representative force versus indentation curve obtained at room temperature. Data collected during the indentation half-cycle are displayed in red, whereas those during retraction are in blue. Notable stages of the nanomechanics experiments are shown with Roman numerals (i to iv). Variables extracted from the data (breaking force F, maximal indentation distance x, and capsid height h) are shown with italic letters. Capsid stiffness (k) is obtained by fitting a line in the initial linear regime of the indentation data (ii). (c) Data set containing 80 similar, overlaid force versus indentation curves collected in independent experiments on different phage particles at room temperature (29). Red and blue traces are indentation and retraction half cycles, respectively. (d) Data set containing 55 similar, overlaid force versus indentation curves (indentation half-cycle only), collected at room temperature in independent experiments, which are similar to each other but are distinctively different from the data set in panel c (putatively called empty-capsid curves).

