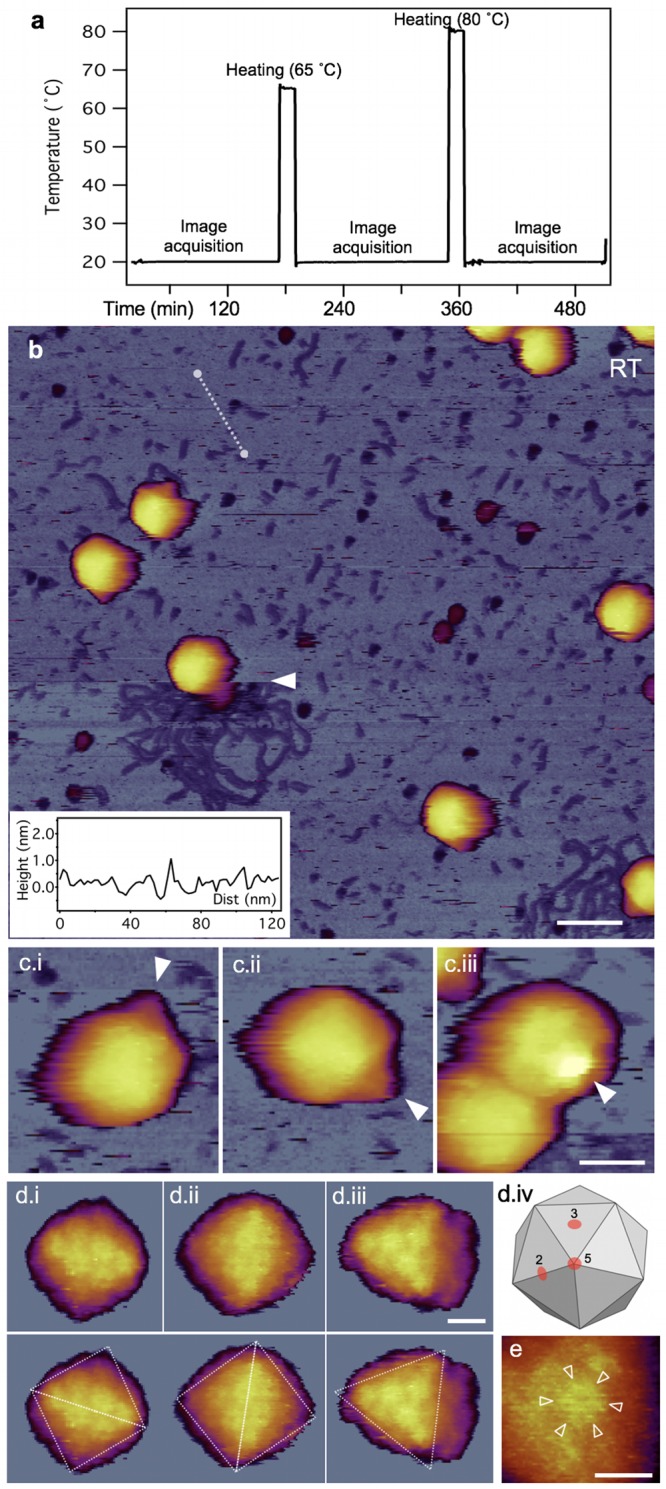
FIG 4.

Temperature-dependent AFM measurements on T7 phage particles. (a) Thermal treatment protocol. Shown is sample temperature versus time trace recorded in a typical experiment. The same sample was exposed to consecutive heating (for 15 min), cooling (to 20°C), and image acquisition (at 20°C) cycles. (b) Overview of a 1-μm by 1-μm sample area at room temperature (20°C). Slow AFM raster scan direction is from top to bottom of the image. The white arrowhead points at the nearly instantaneous event of mechanically induced DNA ejection. Scale bar, 100 nm. (Inset) Topographical height map along an arbitrarily chosen line in the background (white dashed line). (c) AFM images of T7 phage particles displaying their conical tail in different orientations. White arrowheads point at the tail apices. Scale bar, 30 nm. (d) High-resolution AFM images of the T7 phage surfaces with resolvable capsomeres. Views along the 2-fold (I and ii) and 3-fold (iii) symmetry axes, which are explained in image iv, are shown. Scale bar, 10 nm. In the bottom row dashed guiding lines are superimposed on the respective images to indicate the symmetries. (e) Magnified view of a cogwheel-shaped hexagonal capsomere. Arrowheads point at the spokes of the cogwheel. Scale bar, 10 nm.
