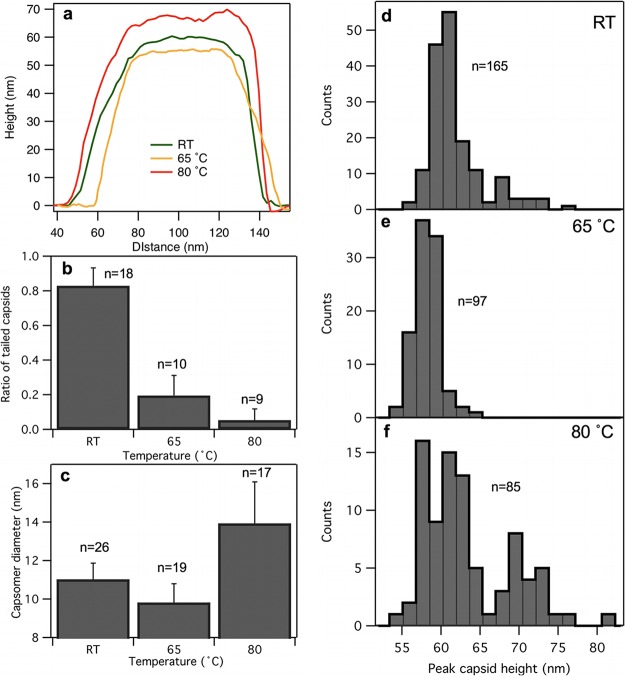
FIG 7.
Analysis of capsid topography data. (a) Topographical height map along the cross section of either a capsid at room temperature (green trace) or ones treated at 65°C (orange) or 80°C (red). (b) Ratio of capsids with tails as a function of temperature. The numbers above the bars represent the number of fields analyzed for every T7 particle. Error bars represent SDs. (c) Capsomer diameter as a function of temperature. The numbers above the bars represent the numbers of capsomers measured. Error bars represent SDs. (d, e, and f) Histograms of peak capsid heights for room temperature-, 65°C-, and 80°C-treated T7 phages, respectively. Peak height refers to the tallest topographical point in the capsid image. The numbers refer to the numbers of T7 phage particles analyzed.

