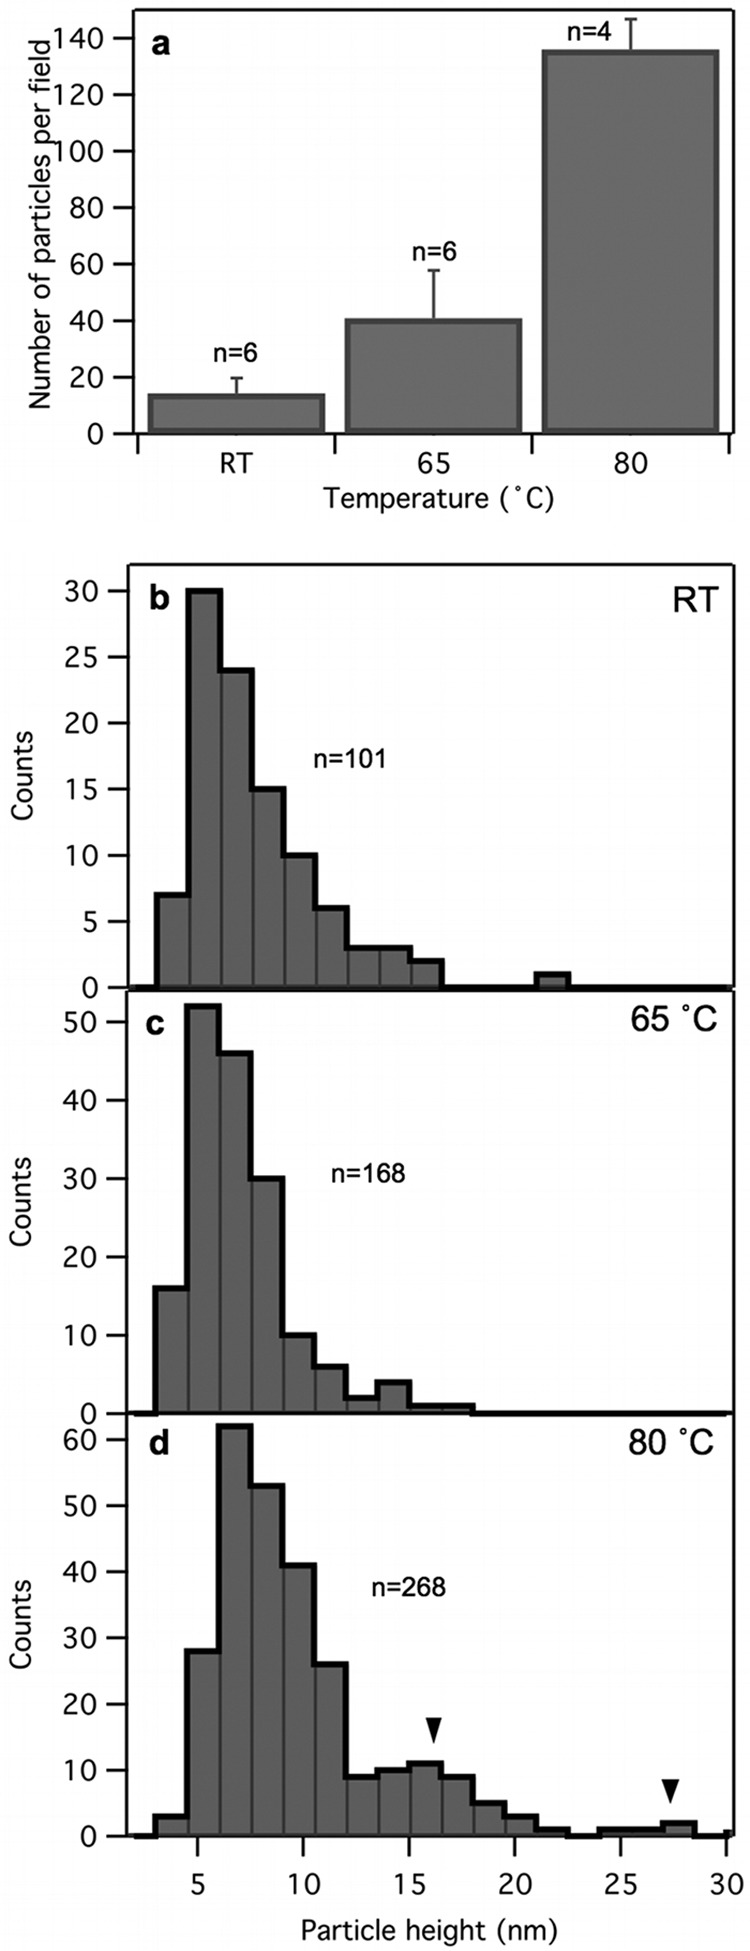
FIG 8.

Analysis of topographical data of globular particles. (a) Number of globular particles per field as a function of temperature. The numbers above the bars represent the numbers of fields analyzed for every particle. Error bars represent SDs. (b, c, and d) Histograms of globular particle height for samples at room temperature and ones treated at 65°C and 80°C, respectively. Black arrowheads point at populations of large globular particles. The numbers refer to the numbers of globular particles analyzed.
