FIG 9.

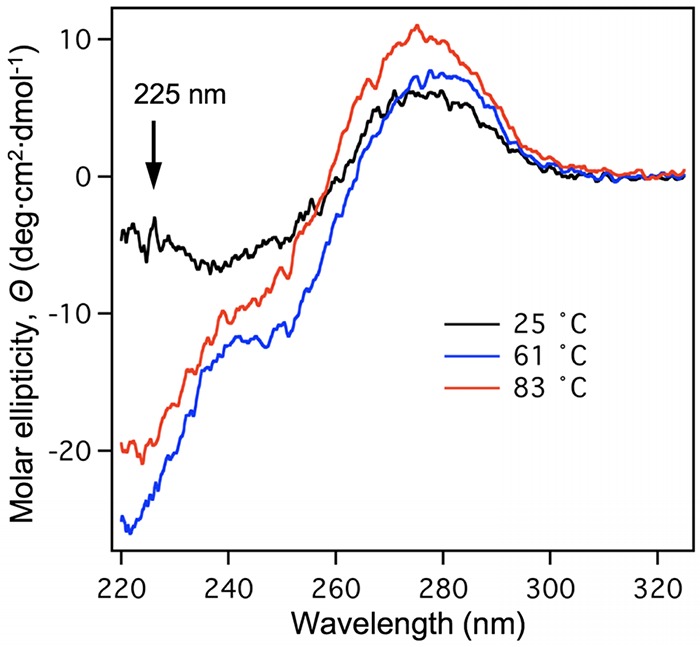
CD spectroscopy of heat-treated T7. CD spectra of T7 samples recorded at room temperature (25°C, black line), 61°C (blue line), and 83°C (red line) are shown. The arrow marks the wavelength of 225 nm, at which the protein-dependent changes were monitored.
