
FIG 3.
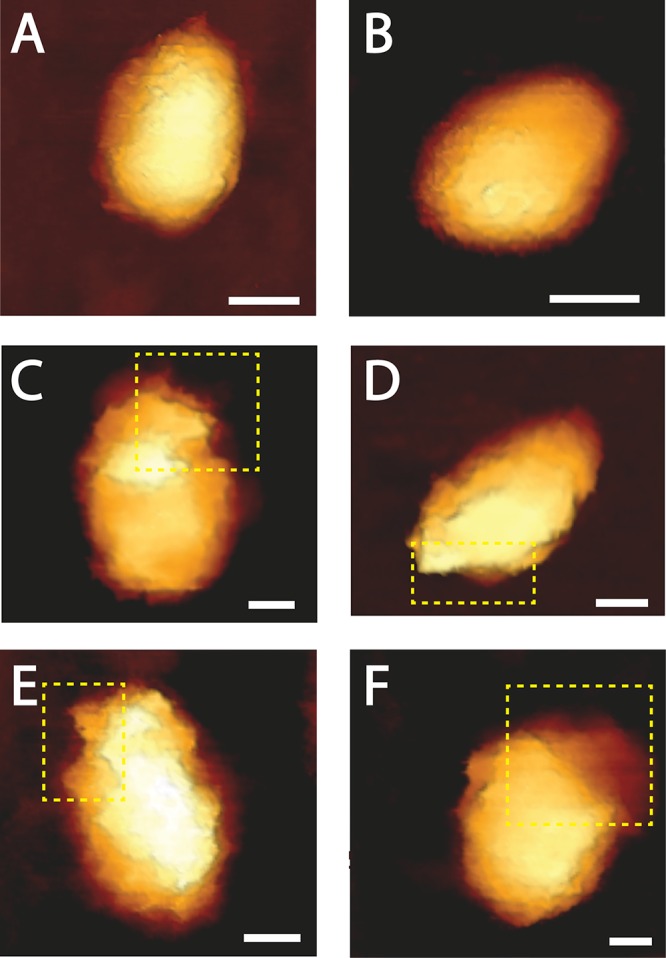
Topographic AFM images of the morphological changes that HIV-1 cores treated with 10 μM PF74 undergo during reverse transcription. Cores were adhered to HMDS-coated glass slides and kept in MOPS buffer. Transcription was initiated by adding dNTPs and MgCl2 to the cores. Images were acquired using the QI mode. (A and B) Typical cone-shaped cores observed prior to reverse transcription (out of a total of 18 cores that were imaged). (C to F) Deformed and opened cores visualized after 9 to 24 h of reverse transcription. For clarity, openings in the cores are shown within a dashed yellow rectangle. Scale bar, 50 nm. A total of 49 cores were visualized during reverse transcription.