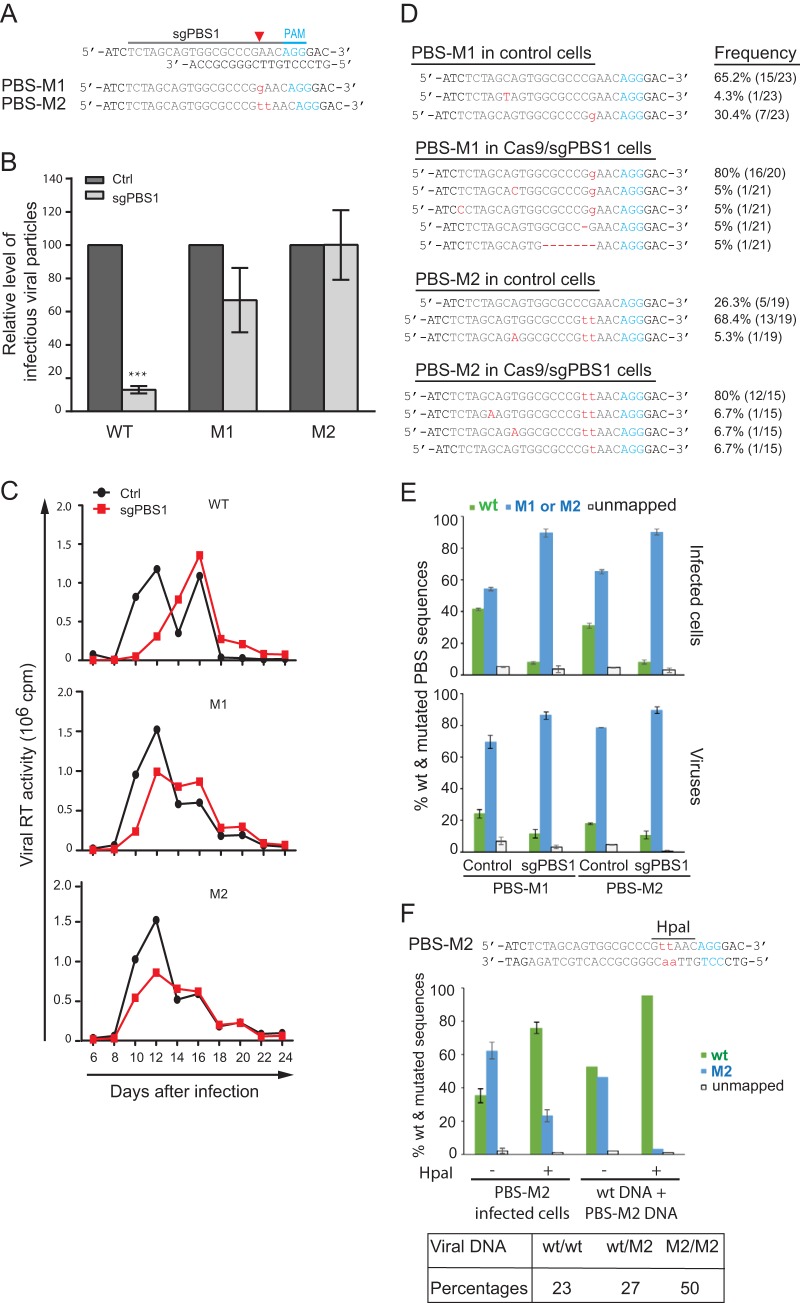
FIG 6.
The PBS-M1 and PBS-M2 mutations allow HIV-1 to resist Cas9/sgPBS1. (A) Depiction of the M1 and M2 mutations (in red letters) in the PBS. (B) M1 and M2 mutations resist Cas9/sgPBS1 inhibition in short-term infection. Wild-type HIV-1 or the M1 or M2 mutant, with the same p24 amounts, was used to infect SupT1 cells expressing the Cas9 clone (control) or Cas9/sgPBS1. Forty hours after infection, the levels of HIV-1 in the culture supernatants were determined by infecting the TZM-bl indicator cells. Results shown are the average values from three independent infection experiments. Levels of each virus from the control cells are set at 100. ***, P < 0.001. (C) Replication of wild-type HIV-1 and the M1 and M2 mutants in control or Cas9/sgPBS1-expressing SupT1 cells. Levels of HIV-1 in the culture supernatants were determined by measuring viral RT activity over various time intervals. Results represent two independent viral replication experiments. (D) Persistence of the M1 and M2 mutations in HIV-1 during long-term replication in the control SupT1 cells or cells expressing Cas9/sgPBS1. Viruses at the peak of replication shown in panel C were collected, and the PBS DNA was amplified and sequenced. The frequencies of the wild-type and mutated sequences are presented. (E) Prevalences of wild-type and mutated PBS sequences in HIV-1-infected cells and in viruses. M1 or M2 mutated virus was used to infect control or Cas9/sgPBS1-expressing SupT1 cells for 40 h. The PBS region was amplified from HIV-1 DNA in the infected cells or from HIV-1 RNA in virus particles. The PCR products were analyzed by MiSeq to register the wild-type and mutated PBS sequences. Results shown are the MiSeq data from three independent infections. (F) Viral DNA was extracted from the M2 virus-infected control SupT1 cells and then treated with HpaI to remove the M2/M2 viral DNA, followed by PCR and MiSeq to determine the percentages of wild-type and M2 PBS sequences. Equal amounts of wild-type HIV-1 plasmid DNA and the M2 HIV-1 plasmid DNA were mixed, treated with HpaI, and then subjected to PCR and MiSeq analysis. The results serve as the control for effective removal of M2 DNA by HpaI digestion. The percentages of wt/wt, wt/M2, and M2/M2 double-stranded PBS DNA in the M2-infected control SupT1 cells were calculated and are presented in the table. Error bars show standard deviations.

