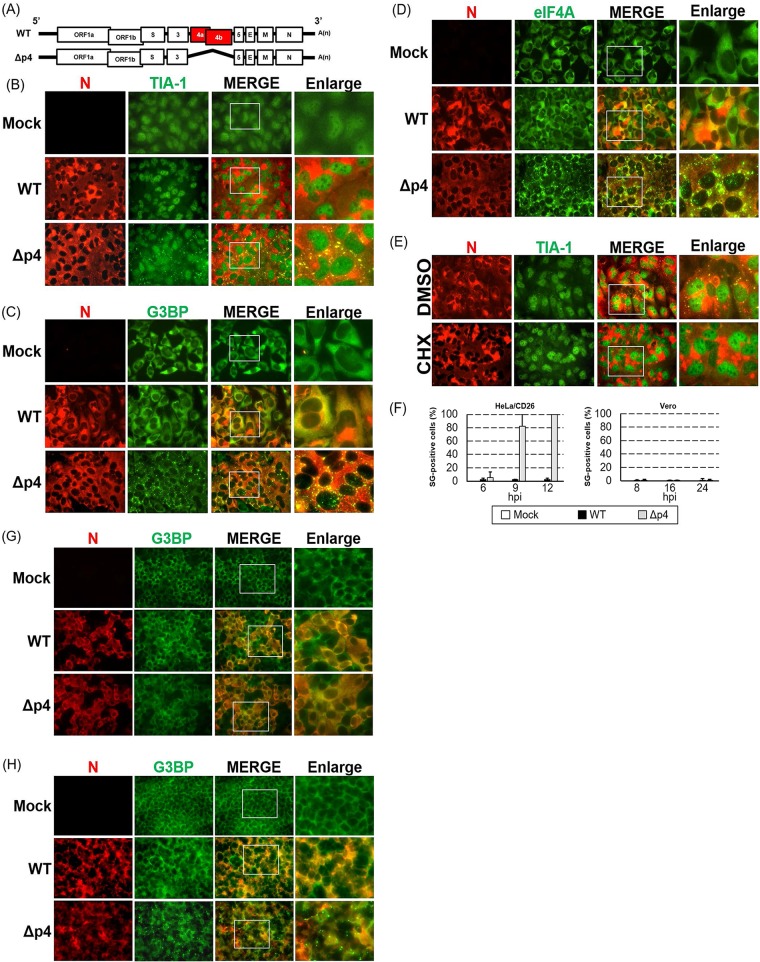
FIG 1.
Induction of SGs in MERS-CoV-Δp4-infected cells. (A) Schematic diagrams of genomes of MERS-CoV-WT (WT) and MERS-CoV-Δp4 (Δp4). The 5′ and 3′ untranslated regions (bars) and viral open reading frames (boxes) are not drawn according to their lengths. (B to D) HeLa/CD26 cells were infected with MERS-CoV-WT or MERS-CoV-Δp4 at an MOI of 3. At 9 h p.i., the infected cells were fixed with 4% formaldehyde and stained for TIA-1 (B), G3BP (C), or eIF4A (D), shown in green, together with the MERS-CoV N protein, shown in red. Right panels show enlarged images of the regions shown in white boxes in the merged image panels. (E) HeLa/CD26 cells were infected with MERS-CoV-Δp4 at an MOI of 3. At 8 h p.i., the infected cells were treated with 100 μg/ml of CHX or DMSO for 1 h. After fixing, the cells were stained for TIA-1 (green) and N protein (red). (F) HeLa/CD26 cells (left) or Vero cells (right) were infected with MERS-CoV-WT or MERS-CoV-Δp4 at an MOI of 3. At the indicated times p.i., the cells were fixed and stained for TIA-1 and MERS-CoV N protein. Among the N protein-positive cells, those carrying at least a single TIA-1-postive granule were counted as SG positive, while SG-negative calls lacked any TIA-1-postive granules. The percentage of SG-positive cells was calculated by counting the number of SG-positive cells out of 25 to 34 N protein-positive cells per field. A total of 20 fields were counted for each sample. Each bar represents the mean (±standard deviation). hpi, hours postinfection. (G, H) Vero cells (G) or 293/CD26 cells (H) were mock infected (Mock) or infected with MERS-CoV-WT or MERS-CoV-Δp4 at an MOI of 3. At 24 h p.i., the infected cells were fixed with 4% formaldehyde and were stained for G3BP (green), together with MERS-CoV N protein (red).

