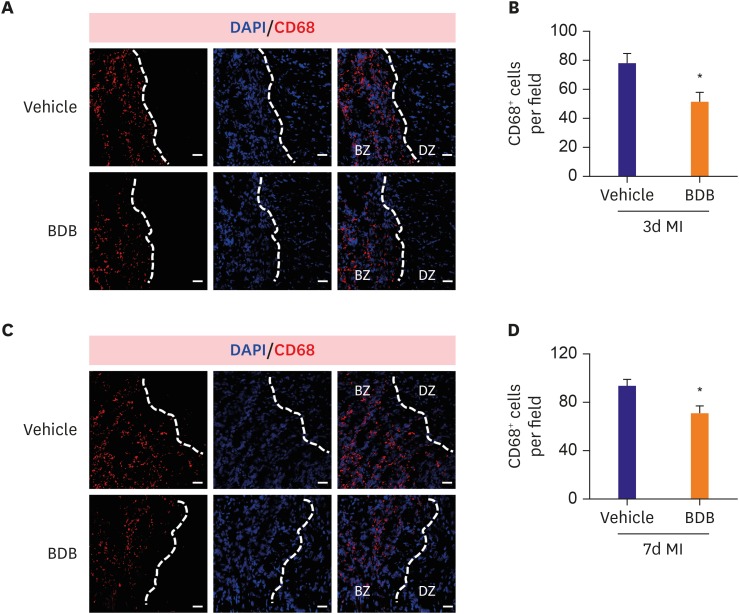
Figure 3. BDB treatment reduced macrophages infiltration after MI in mice. The representative CD68 (red) staining images of the infarcted hearts from BDB- or vehicle-treated mice at day 3 (A) and day 7 (C) post-MI (scale bar, 50 μm). (B) Quantitation of CD68+ cells in injured hearts as shown in (A). (D) Quantitation of CD68+ cells of infarcted hearts as shown in (C). Data are expressed as mean±SEM (n=8–10).
BDB = 3-Bromo-4,5-dihydroxybenzaldehyde; BZ = ischemic border zone; DAPI = 4′,6-diamidino-2-phenylindole; DZ = non-ischemic distant zone; MI = myocardial infarction; SEM = standard error of measurement.
*The p<0.05 compared with vehicle group.

