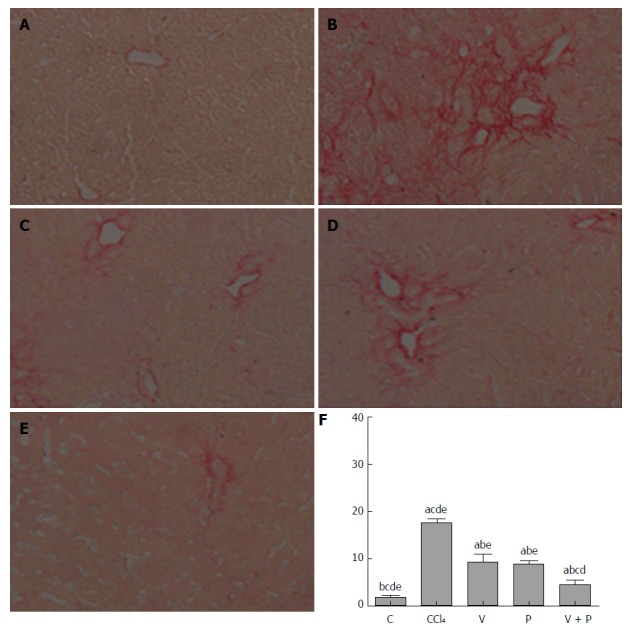
Figure 2.

Sirius red staining. A: Control (C) group; B: CCl4 group; C: Vitamin D (V) group; D: Puerarin (P) group; E: V + P group (200 × magnification); F: Statistical graph of positive Sirius-red-stained areas (in the comparison of the mean ± SD of various groups, differences are statistically significant when P < 0.05, n = 10. a, b, c, d, and e represent statistical differences vs C, CCl4, V, P, and V + P groups, respectively).
