Figure 5.
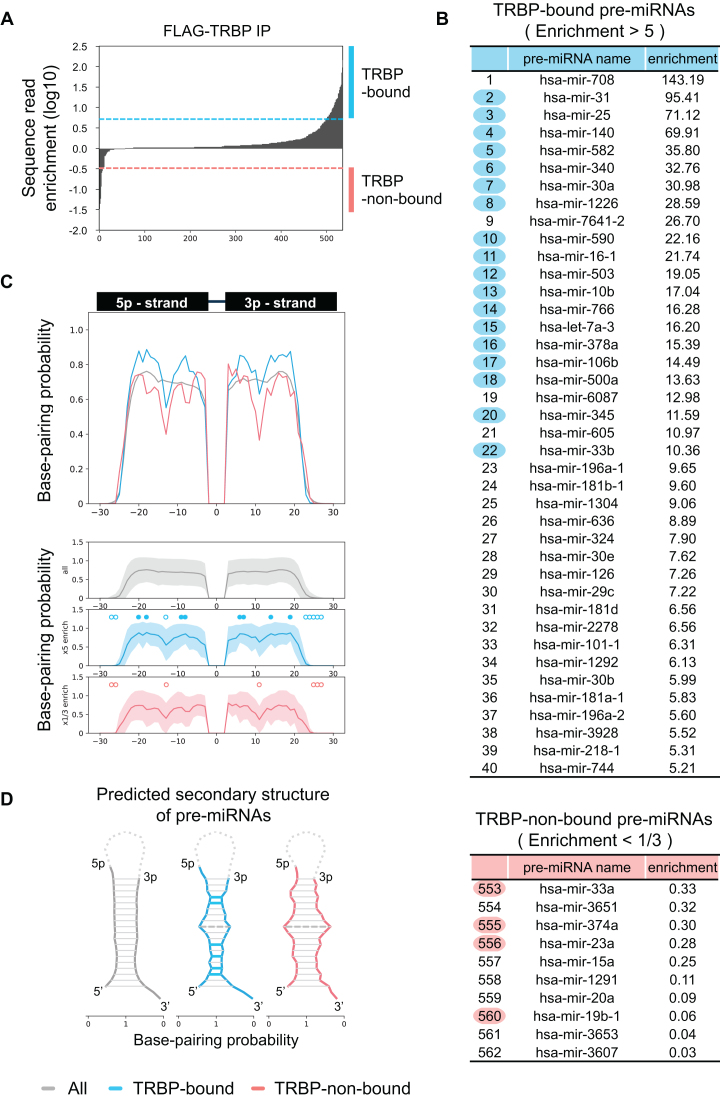
TRBP has a binding preference for specific miRNAs with stems showing tight base-pairing. (A) Enrichment analysis of TRBP-bound pre-miRNAs. Immunoprecipitation was performed with anti-FLAG antibody using Flp-In 293 FLAG-TRBP stable cells, and TRBP-bound RNAs were purified from the immunoprecipitates. RNA sequencing was performed using the small RNA fraction (15–110 nucleotides, nts). Sequence read enrichment by immunoprecipitation was calculated and compared with input RNA not subjected to immunoprecipitation. A total of 562 pre-miRNAs were immunoprecipitated with TRBP. (B) The top 40 TRBP-bound pre-miRNAs and bottom 10 TRBP-non-bound pre-miRNAs. Blue or pink circles indicate pre-miRNAs used for expression analysis of target transcripts on Figure 6C. (C) Base-pairing probability (BPP) values of all pre-miRNAs (gray), the top 40 TRBP-bound pre-miRNAs (blue, sequence read enrichment by immunoprecipitation > 5) and bottom 10 TRBP-non-bound miRNAs (pink, sequence read enrichment by immunoprecipitation < 1/3) were calculated using the max value of base-pairing calculated by CentroidFold. Filled or open circles indicate the nt region that is significantly high and low, respectively, by Student's t-test (*P < 0.05). The nt positions −20, −18, −9, −8, +6, +7, +14 and +19 in TRBP-bound pre-miRNAs showed significantly high BPP values, and positions −27, −26, −13, +23, +24, +25, +26, and +27 showed significantly low BPP values compared to all pre-miRNAs. The nt positions −27, −26, −13, +11, +25, +26 and +27 in TRBP-non-bound pre-miRNAs showed significantly low BPP values compared to all pre-miRNAs. The 3′-terminal nt of 5p miRNA is nt position ‘−3′ and the 5′-terminal nt of 3p miRNA is nt position ‘3’. In the lower graphs, the light gray, blue, and pink areas above and below the solid lines show the standard deviations. (D) Predicted secondary structures of all pre-miRNA (gray), TRBP-bound pre-miRNA (blue), and TRBP-non-bound pre-miRNA (pink) based on BPP values. The horizontal lines between 5p and 3p miRNAs represent base-pairing, and solid or dotted colored lines indicate the positions that show significantly high and low BPP values, respectively, by Student's t-test (*P < 0.05).

