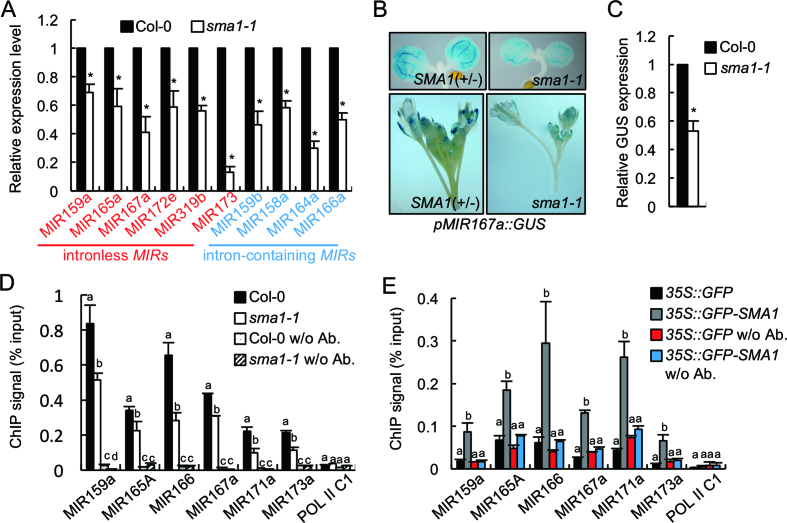
Figure 5.
SMA1 is required for MIR transcription. (A) Pri-miRNA levels in Col-0 and sma1-1 detected by RT-qPCR. Pri-miRNA levels in sma1-1 were normalized to those of UBQ5 and compared with Col-0 (set as 1). (B) Histochemical GUS staining of five-day-old seedlings and inflorescences in Col-0 and sma1-1 harboring the pMIR167a::GUS transgene. Fifteen plants containing GUS were analyzed for each genotype and one image for each genotype is shown. (C) GUS transcript levels in Col-0 and sma1-1 harboring the pMIR167a::GUS transgene. GUS transcript levels detected by RT-qPCR were normalized to those of UBQ5 and compared with Col-0 (set as 1). (D) The occupancy of Pol II at MIR promoters in Col-0 and sma1-1 detected by ChIP followed by qPCR. The intergenic region between At2g17470 and At2g17460 (POL II C1) was used as a negative control. IP was performed using anti-RPB1 antibodies. (E) The association of GFP and GFP-SMA1 with MIR promoters in transgenic plants containing 35S::GFP or 35S::GFP-SMA1. The occupancy of GFP-SMA1 and GFP at MIR promoters was detected by qPCR following ChIP. The intergenic region between At2g17470 and At2g17460 (POL II C1) was used as a negative control. IP was performed using anti-GFP antibodies. Error bars (A–E) indicate standard deviations (SD) of three replicates. * in A and C: P < 0.05 with one-sample t-test. Means with different letters are significantly different determined by ANOVA (P < 0.05).

