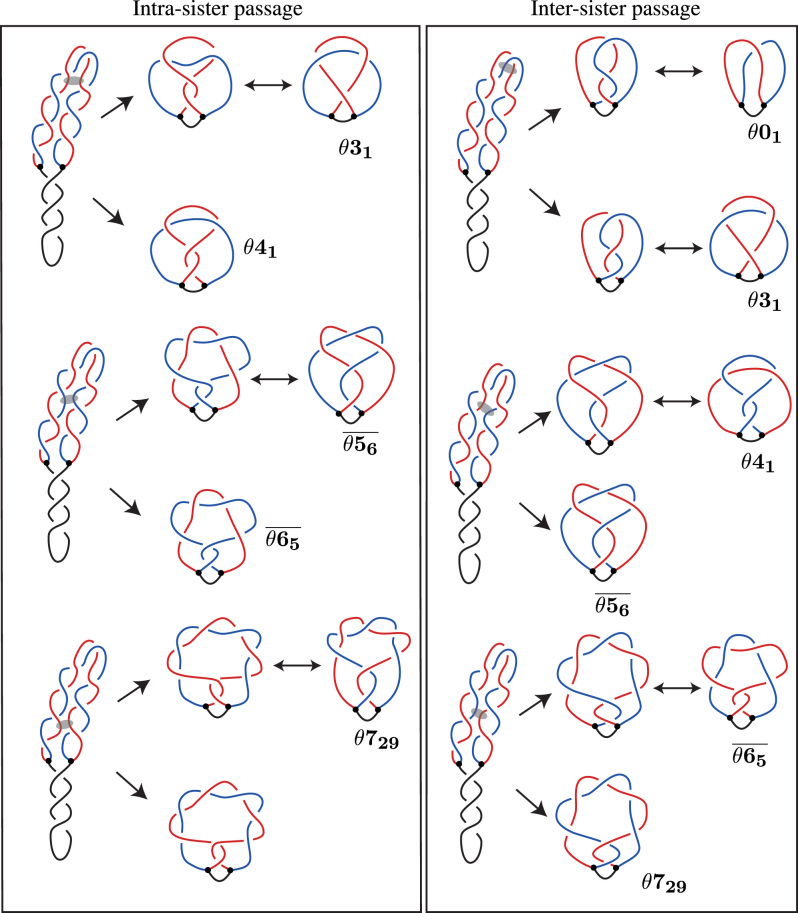
Figure 6.
Our general model of knotting in RIs, with a comparison between the two pathways. The left column shows the possible resulting RIs from the previous pathway of knotting up to eight crossings. The right column shows the possible resulting RIs from our new pathway of knotting up to seven crossings. Like in Figures 4 and 5 the semi-transparent ovals indicate portions of freshly replicated duplexes that will serve as substrate of Topo IV mediated DNA–DNA passages in respective analyzed cases. (The complex knotted θ-curve that is shown in the lower part of the left panel is not labeled because the Litherland–Moriuchi Table is limited to θ-curves with up to seven crossings.)

