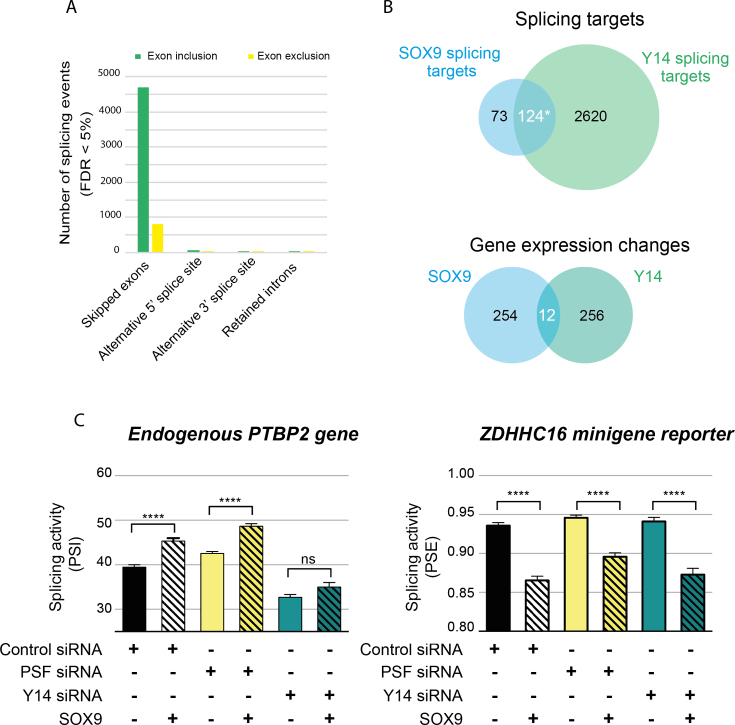
Figure 6.
SOX9 and Y14 regulate the splicing of a common set of genes. (A) MATS analysis of RNA-seq data of DLD-1 cells upon Y14 knockdown. The inhibition of Y14 expression induces thousands of splicing changes, which are mostly in exon cassettes. In green, splicing events with a positive ΔPSI in MATS analysis represent the induction of exon inclusion by Y14. In contrast, exon exclusions are represented in yellow. (B) Venn diagrams showing the overlap of SOX9 and Y14 splicing targets and SOX9 and Y14 gene expression changes. Y14 shares 60% of SOX9 splicing targets but <5% of its transcriptional targets. *The probability of incorrectly concluding that SOX9 and Y14 splicing targets overlap was determined using a two-sided t-test against the bootstrapped distribution of common targets between SOX9 and 2744 randomly sampled genes and is P = 1.3e–142. (C) Functional interaction between SOX9 and Y14. HEK293T cells were co-transfected with control, anti-PSF or anti-Y14 siRNAs, together with either a control plasmid or wt SOX9. The levels of mRNA variants of the endogenous PTBP2 and ZDHHC16 reporter minigene were quantified by RT-PCR. PSI and PSE were then calculated for PTBP2 and ZDHHC16, respectively. Data are presented as means ± SEM (n ≥ 5). ****P < 0.0001 with a one-way ANOVA test with Bonferroni’s multiple comparison test.

