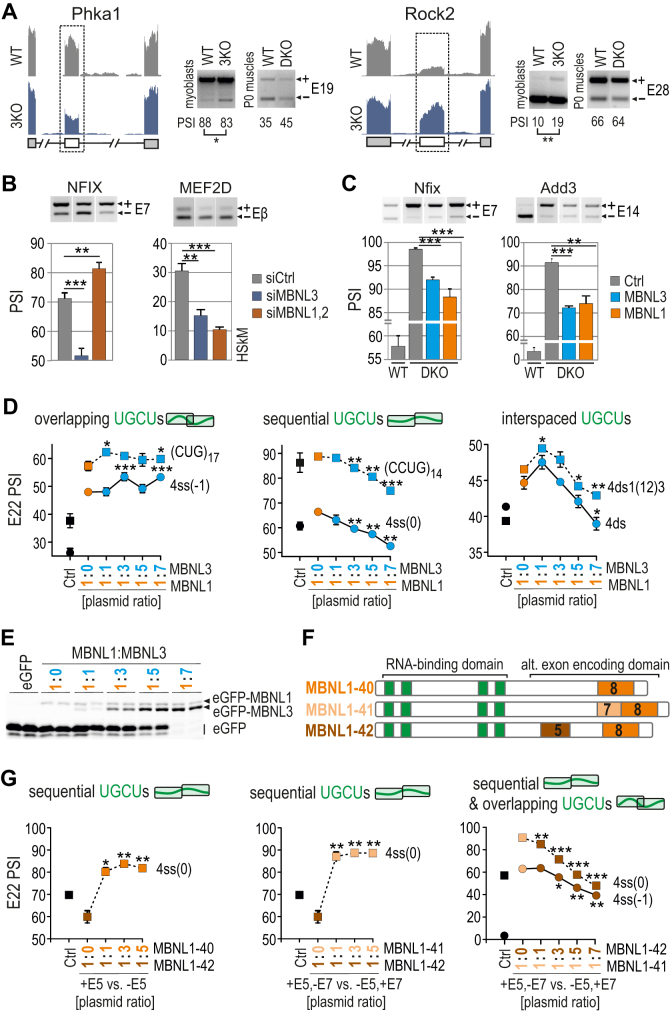
Figure 6.
Competition between MBNL proteins is driven by RNA regulatory element organization. (A) RNA-seq read coverage across two MBNL-dependent alternative exons indicating their adult-like splicing profiles in Mbnl3 knockout (3KO) myoblasts compared to wild-type cells and Mbnl1; Mbnl2 DKO quadriceps muscle (postnatal, day 0); alternative and constitutive exons are marked with white or gray boxes, respectively; n = 2. Note that the effect of 3KO is opposite to the effect of DKO. (B) RT-PCR results of splicing changes in two MBNL1-dependent alternative exons which direction was opposite upon MBNL3 silencing (3KD) compared to MBNL1; MBNL2 double knockdown (DKD) with respect to cells treated with control siRNA in human skeletal myoblasts (HSkM); n = 3. (C) RT-PCR results of splicing changes in MBNL1-dependent alternative exons which direction was similar upon MBNL3 and MBNL1 OE in Mbnl1; Mbnl2 DKO MEFs; Ctrl, the results from eGFP construct transfected cells (marked in grey); n = 3. (D) A competition assay between MBNL1 and MBNL3 paralogs. RT-PCR results showing the splicing response of pre-mRNAs with distinctly arranged UGCU motifs in intronic regulatory elements in constant background of MBNL1 OE (marked in orange) and with increasing concentration of MBNL3 (marked in blue) in HeLa cells. MBNL1 and MBNL3 paralogs are identical with respect to splicing isoforms (lacking residues encoded by alternative exons 5 and 7); Ctrl, the results from eGFP construct transfected cells (marked in black). The asterisks denote the statistical significance of results in comparison to cells with MBNL1 OE only (marked in orange); n = 2. Each graph represents the results obtained for two constructs belonging to the category of RNA regulatory elements with overlapping, sequential or interspaced UGCU motifs. (E) Image of polyacrylamide gels presenting the expression level of eGFP-MBNL1 and eGFP-MBNL3 fusion proteins and eGFP alone. After electrophoresis gels were scanned for eGFP fluorescence (protein samples were not heat-denatured before gel loading). (F) A schematic representation of MBNL1 splicing isoforms differing in the presence of residues encoded by alternative exons 5 and 7 (marked in brown and beige, respectively) but sharing the same RNA binding domain composed of four ZFs (marked in green). (G) As in Figure 6D but for MBNL1 isoform pairs. An equal amount of applied expression vectors resulted in 2:1 ratio of expressed proteins for MBNL1–42 versus MBNL1–40/41 (30). MBNL1–40, MBNL1–41 and MBNL1–42 are marked in orange, beige and brown, respectively. The asterisks denote the statistical significance of results in comparison to cells with overexpression of only one isoform; n = 2.

