Figure 4.
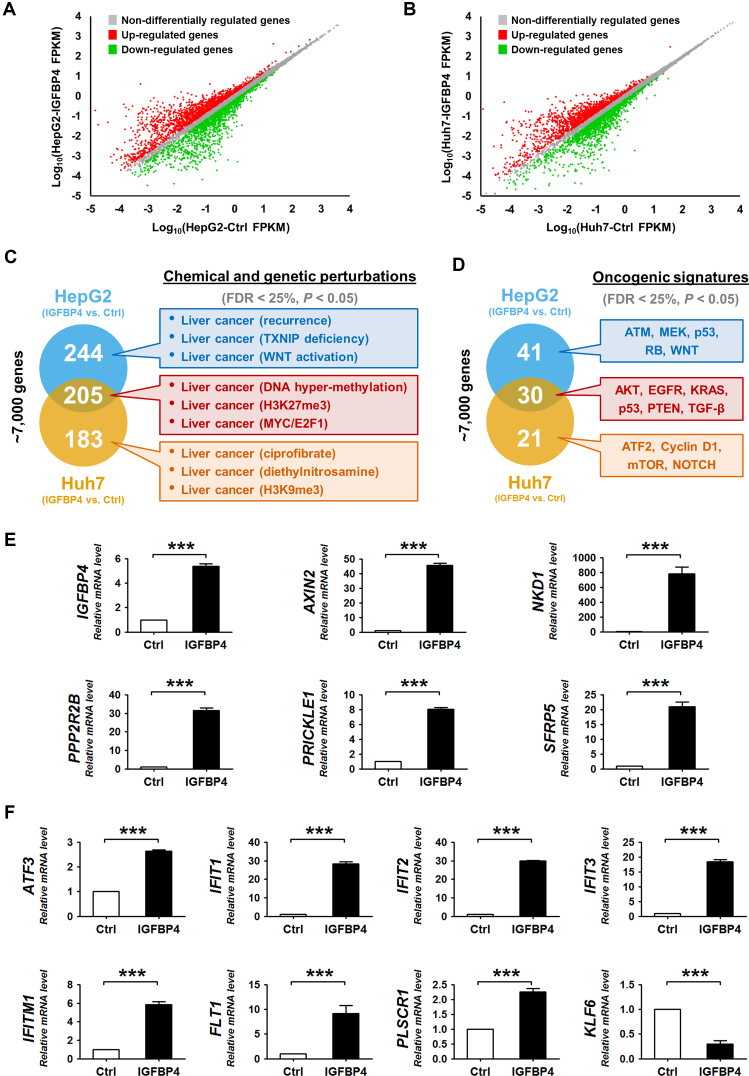
IGFBP4 modulates oncogenic signaling pathways. (A and B) Scatter plots showing the global gene expression in (A) HepG2 and (B) Huh7 cells with or without IGFBP4 re-expression. The differentially regulated genes (with >1.5-fold change) are marked in green and red, respectively. FPKM = fragments per kilobase of transcript per million mapped reads. (C and D) GSEA analyses of the ∼7000 differentially regulated genes in HepG2 and Huh7 cells with or without IGFBP4 re-expression. These genes were classified according to the predefined gene sets in the MSigDB. Selected enrichment items are highlighted in the colored boxes. (E and F) qRT-PCR analyses of Huh7 cell-derived xenografts with or without IGFBP4 re-expression, in which the relative expression of (E) IGFBP4 and Wnt antagonists, and (F) AKT downstream molecules was examined. ***P < 0.001.

