FIG 2.

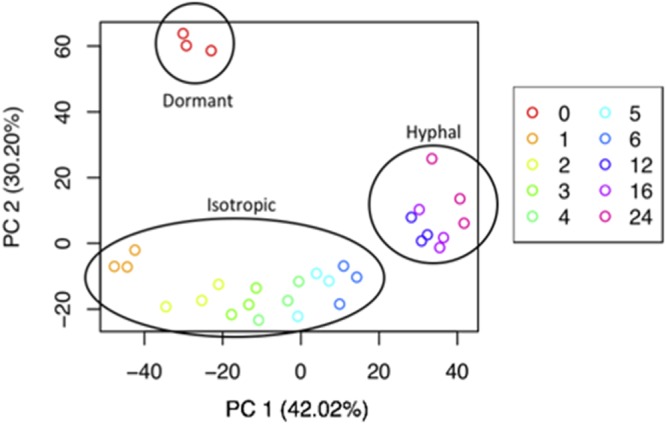
Principal-component analysis of 7,942 genes differentially expressed across all time points (n = 3 for each time point; T = 0, 1, 2, 3, 4, 5, 6, 12, 16, or 24 h postgermination). Each time point is color coded.

Principal-component analysis of 7,942 genes differentially expressed across all time points (n = 3 for each time point; T = 0, 1, 2, 3, 4, 5, 6, 12, 16, or 24 h postgermination). Each time point is color coded.