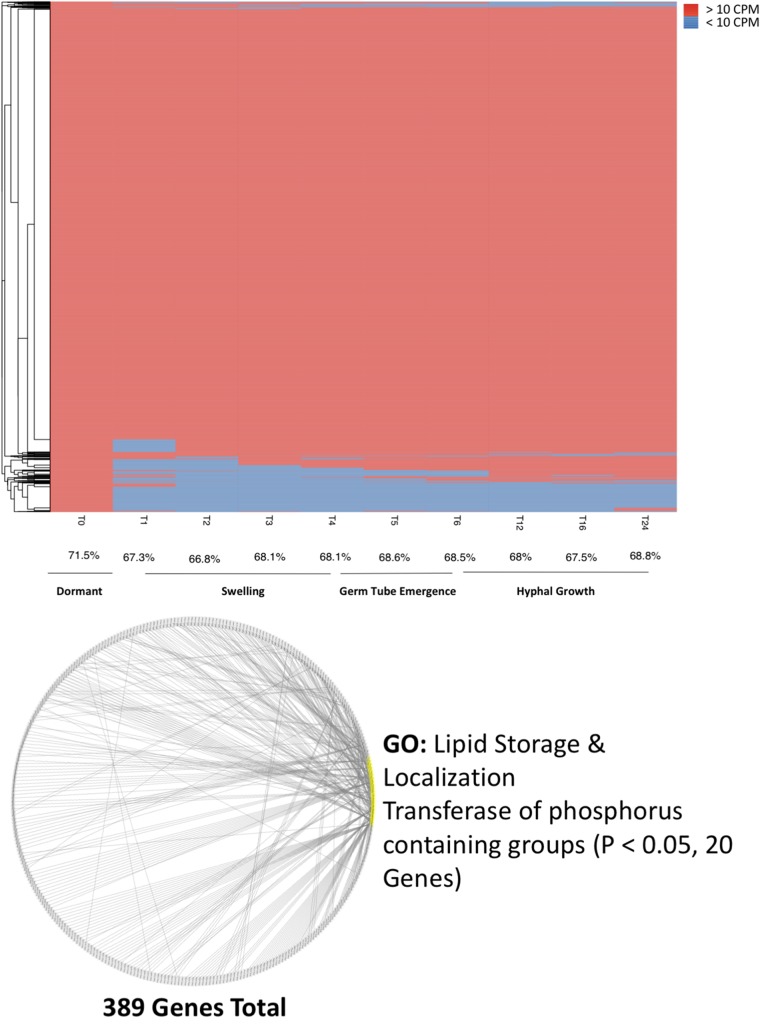
FIG 3.
Resting-spore-specific expression. (Top) Heat map displaying the absence (blue) or presence (red) of 10 or more transcripts for a given gene over time. The average percentage of the transcriptome expressed at any given time point is given below. (Bottom) Coexpression diagram, where each node represents a gene only expressed in ungerminated spores. Nodes linked to 10 or more others are highlighted in yellow, with their functions shown adjacent.

