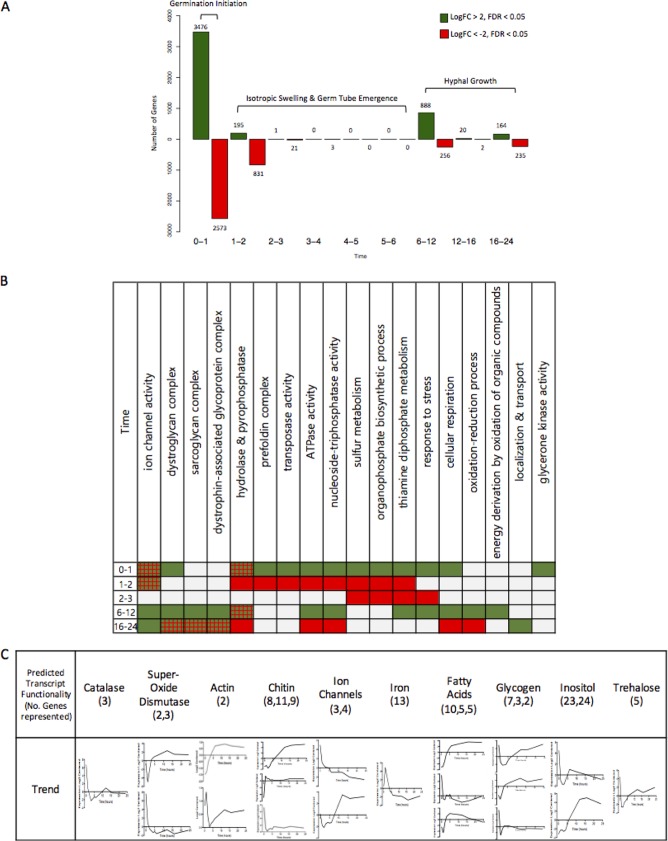
FIG 5.
Differential gene expression over time. (A) The number of genes significantly differentially expressed (multiply corrected P value of <0.05) between time points, shown over time. Green bars indicate genes with an increase in expression (log fold change [FC] of >2), while red bars indicate genes with a decrease in expression (log FC of <−2). (B) Enriched categories for the up- or downregulated genes over time. Green boxes indicate an overall upregulation of this category, red indicates an overall downregulation and red-green hatching indicates mixed regulation of this category. (C) Expression profiles of transcripts in specific categories over time, with the number of transcripts represented by each trend shown in parentheses.

